
The price of crude oil topped out in June 2014, then bottomed in February 2016 and has since partially recovered. During this period, the price of oil plunged by 76% and reached historic proportions, even in relation to other energy boom and bust cycles of the past. Let’s update the energy sector’s present status and use historical trends to anticipate what the future holds for investors. Not wanting to keep the reader in suspense, our conclusion is a new cyclical bull market in the oil patch has begun and opens the door to significant investment opportunities. We like the business prospects for venerable integrated oil giant Chevron, and later in the report will explain why.
Why Are Secular and Business Cycle Trends Important?
Our core investment advisor philosophy revolves around understanding how financial assets, including stocks, bonds and commodities behave within business cycles and secular (very long-term) trends. Simply stated, it is important not to extrapolate past good or bad times indefinitely into the future, and instead to be vigilant for critical cyclical turning points. With that in mind, let us examine the trends affecting the current oil market.
First, a trend is a period in which a price moves in an irregular but persistent direction. Trends that revolve around the typical four- to five –year business cycle are known as cyclical trends. When investors refer to “bull” and “bear” markets they are usually talking about these cyclical swings. Naturally, as with other economically sensitive commodities, oil prices will generally firm up during periods of economic growth and weaken during recessionary periods. These are the normal cyclical price moves associated with boom and bust periods within the economy. On the other hand, secular trends are more powerful and often much longer term in nature as they can embrace several business cycles. These trends develop both positively and negatively, and they can last for a decade or more.
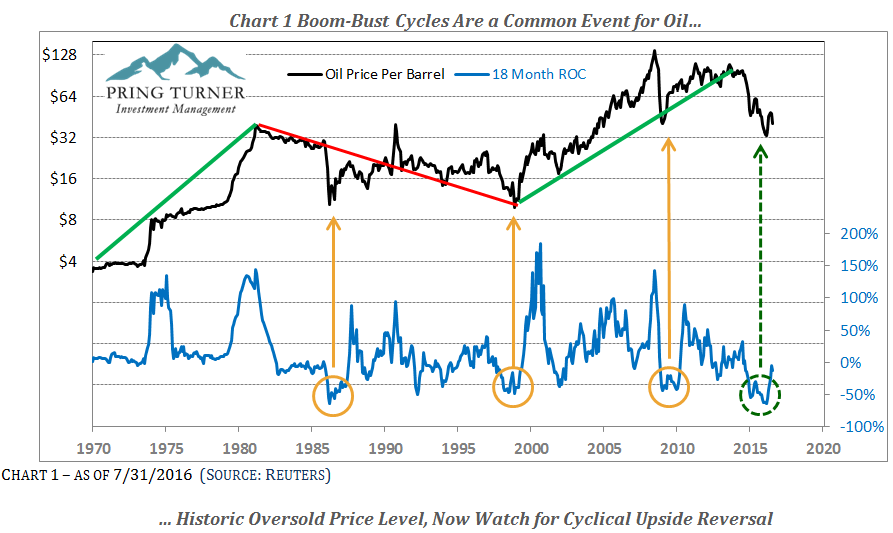
The top half of Chart 1 shows the price history of oil back to the early 1960’s. The cyclicality of the oil market is evident in the series of price “humps” every few years. Trend lines on the chart reveal the secular bull market beginning in 1973 when an OPEC oil embargo shocked prices, followed by a secular sideways market from 1981 through 1998, and a new secular bull market lasting until 2014. In our judgment, the days of OPEC’s power in setting global oil prices is officially over. Thanks in large part to the U.S. shale industry taking over as the new global swing producer of oil, we suspect a new secular range-bound market is currently in place. The combination of a fracking boom, more efficient cars and the growth of alternative energy sources limits the upside of crude oil on a secular basis. Any further oil rebound into the $50’s would likely lead to a rekindling in shale drilling activity, boosting supply and limiting the upside in prices to perhaps the $70’s. Temporary price spikes are a fact of life in the oil markets especially if Middle-East tensions re-ignite. On the downside, roughly $30/barrel establishes a floor below which a significant amount of global production is unprofitable. Looks to us like a recipe for a lengthy period of sideways price action.
The bottom half of Chart 1 shows a technical analysis tool, the 18-month Rate-of-Change (ROC)—a momentum indicator designed to identify overstretched price extremes in any market. In the case of oil prices, the 18 month ROC reached record low levels in early 2016 indicating a historic oversold condition. In the past, such severe oversold levels ultimately led to significant price appreciation once momentum reversed to the upside. This is one important indication the brutal oil price decline is in the process of ending and the birth of a new cyclical bull market is at hand.
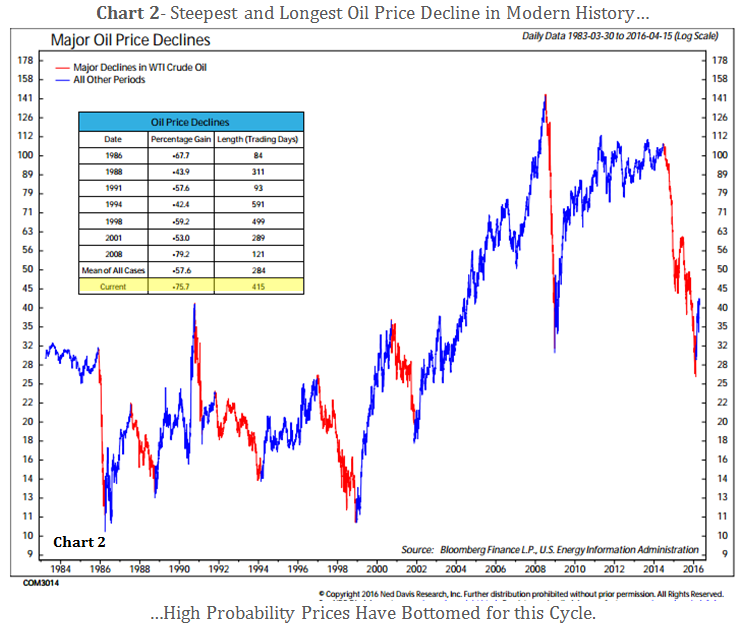
Big price swings from one extreme to another are a common historical event we should expect from oil. Another way of putting the current oil price rout in perspective is to compare this decline with the seven severe bear markets since the early 1980’s. Chart 2 with the table, from Ned Davis Research, illustrates each significant bear market percentage loss along with length of time in the downtrend. The average decline measured almost -58% and lasted 284 trading days. The recent -76% decline over 415 days clearly ranks amongst the steepest and longest oil bear markets in history. While nobody can say for sure if the final bear market low is already in place, history says that both in terms of percentage price decline and time that there is a high probability oil prices have indeed bottomed out.
Bottom line, while we may be on the cusp of a new cyclical bull market for oil it appears that the secular trend has changed from bullish to range bound. In the shorter term (next few years) oil prices could rebound strongly but over the longer term (next decade and longer) prices may very well remain locked in a trading range type of environment.
Catalyst for Improvement
Clearly, supply and demand in the oil market has been severely out of balance the last couple years and the historic price decline reflects that the U.S. shale boom has revolutionized this imbalance. Adding fuel to the fire, for the first time in history, Saudi Arabia decided to increase production in the midst of this already vicious down cycle, further swelling the oversupply. In stark terms, OPEC is officially dead and pricing power has returned to U.S. producers.
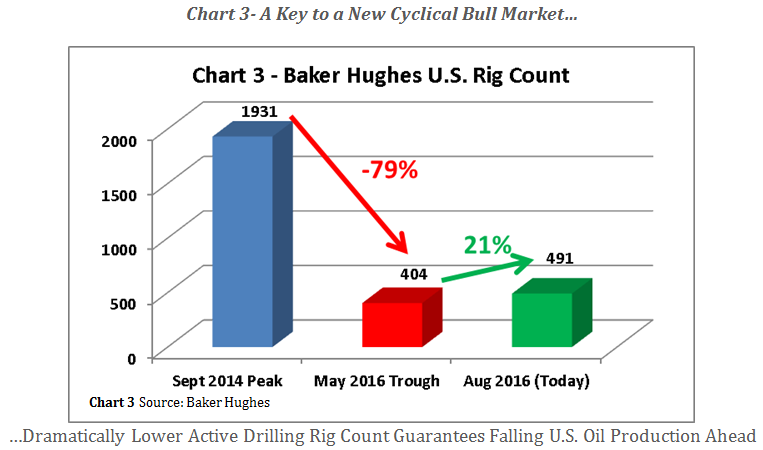
How large of an imbalance is there and how long will it take to bring prices and supply back into equilibrium? Most estimates put current global production at around 95 million barrels a day, which is about 2 million barrels a day more than needed. Demand has actually grown and will likely continue to do so, but not enough to totally offset today’s excess production. Non-OPEC production has slowed with the biggest influence coming from the U.S. shale industry—the new swing producer in the world. The agile shale industry is quickly adapting to changing oil prices and sharply curtailing drilling activity. In fact, (Chart 3 below) as of May of 2016, U.S. drilling rig activity dropped to only 404 rigs in operation compared to 1,931 at the peak in September 2014, that’s a whopping 79% decline from the peak! From the 404 rig low count in May there has been a 21% improvement to 491, telling us the oil industry believes the bottom for oil is in.
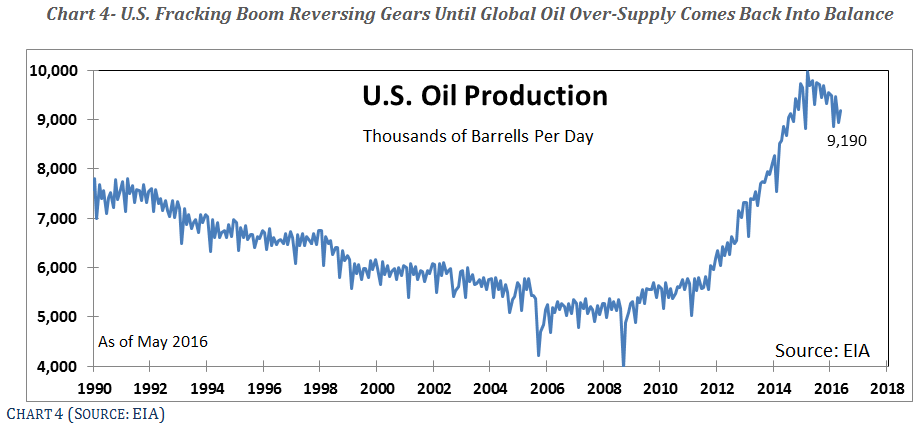
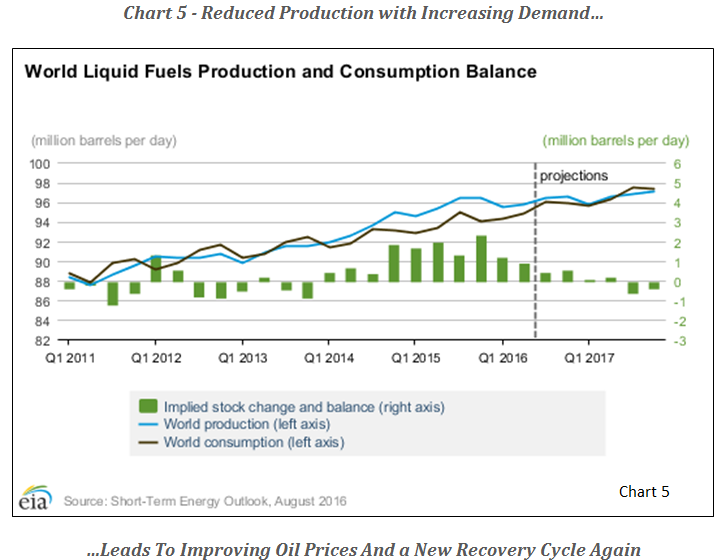
The historic reduction in U.S. drilling activity will have a substantial effect on world oil supply, eventually leading to sharply lower production, albeit with a lag. Chart 4 illustrates the significant U.S. oil production decline already and following the rig count data, further decline is yet to come. Forecasts from the U. S. Energy Information Administration (EIA) as shown in Chart 5 seem reasonable to us. Barring any significant unanticipated Middle East crisis or other market disruptions, supply and demand should come into balance by sometime late this year or early 2017.
Energy Stocks—Bottoming?
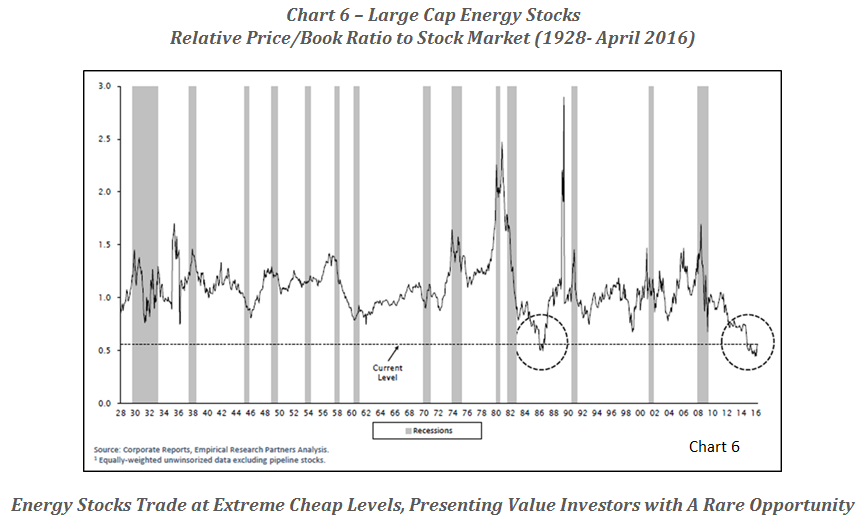
What does all of this oil price information mean for investors? A major reason why retirees hire us to manage their investments is because we always strive to build several layers of risk protection into portfolios. As conservative investment managers with an eye toward quality, value and income, we believe there is an exceptional opportunity in energy for patient, value-oriented investors. The severe price decline in oil prices has overstretched many long term valuation measures in energy stocks to historic low levels. For instance Chart 6, courtesy of Empirical Research Partners and BP Capital Fund Advisors, shows an important value measure for energy stocks. The chart depicts the relative price to book value of energy stocks compared to the overall stock market was recently at its lowest going back all the way to 1928! To clarify, book value equates to the amount of money a shareholder would receive in the event a company were to sell all assets, pay off all debts and dissolve itself. It is rare indeed for investors to be able to buy shares in an energy company at such low historic valuations.
Crisis and historic boom and bust rotations are not new in the oil patch. As disciplined value investment advisors our patience is rewarded during these “busts” as we can take advantage by investing in high quality companies at bargain prices—the most reliable recipe for long-term investment success. One example of a high quality company in the energy industry showing good value is Chevron Corporation.
A Case Study of Chevron
From its first southern California well in 1876, Pico’s 25 barrels of oil a day, to 2016’s 2 ½ million barrels daily global production, Chevron has withstood, like other leading energy companies, numerous challenges dealing with economic adversity and the boom – bust oil cycle. This company has survived two world wars including having one of its tanker ships sunk during World War II, other geo-political adversities and asset nationalization. It has endured through twenty-nine recessions including the Great Depression when oil dropped to only 11 cents a barrel. Lastly, the company has dealt with numerous unique problems including refinery fires, oil spills, heavy-handed EPA mandates, and never-ending litigation hurdles. Through all these adverse headwinds Chevron has still risen to rank in the top 20 on the Fortune 500 list of corporate America. Yes, it has worked through much worse than today’s oil price decline and risen to higher heights, rewarding patient long-term shareholders.
Once again, there has been plenty of financial stress on Chevron over the last couple of challenging years, as earnings and cash flow declined significantly during the down phase of this energy cycle. Nonetheless, management has actively been taking steps to right the ship by significantly reducing capital spending and operating expenditures. And Chevron has many key attributes that will ensure its future for shareholders. The first is its superior financial strength with low debt, which provides the company with flexibility and allows management to commit to maintaining and growing the dividend. We take management at their word when they call the dividend “sacrosanct”. The second is its integrated status, providing diversification all along the energy chain from exploration, refineries, transportation, chemical products and all the way down to its retail service stations. This means Chevron has multiple places it can make adjustments to cut costs and move efforts to more profitable uses. Importantly, massive capital spending on Australian LNG projects is nearly complete, positioning CVX to reap rewards as cash begins to flow back to the company and help drive growth for many decades. Lastly, a tough and talented management team is led by 36 year Chevron veteran John Watson, who prior to becoming CEO was amongst other important positions, was the VP responsible for long-range strategic planning and acquisitions and VP of finance—leadership qualities well-suited to meet today’s challenges.
From a Technical Standpoint
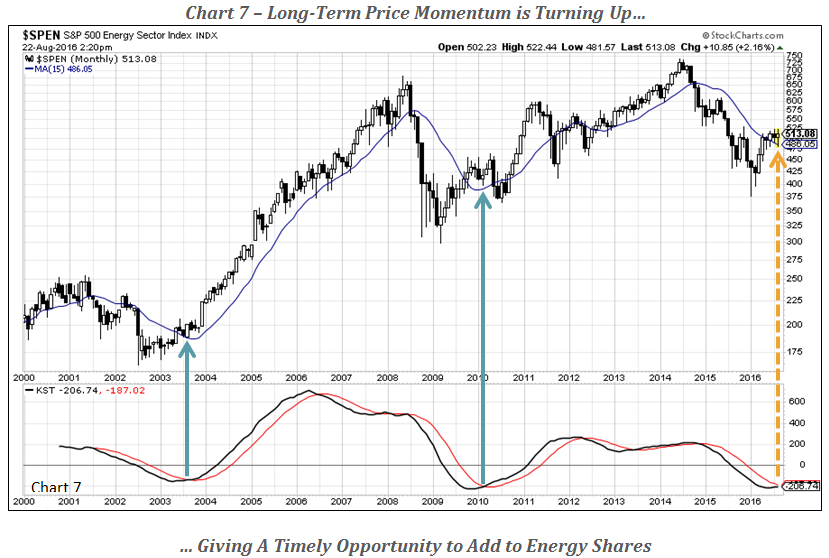
The last critical question for an investor to ask oneself is, are energy shares a timely purchase? As chronicled earlier in this report, fundamentals (valuation) look attractive on a long-term basis. We like to marry the fundamental picture with our technical and business cycle analysis work to help answer the timeliness question. Chart 7 shows the S&P 500 Energy Index’s monthly price history with its 15-month moving average in blue. This index tracks the performance of S&P 500 energy stocks, its three largest components include Exxon Mobil, Chevron, and Schlumberger. Cyclical good and bad periods are easily identified by observing if the index price is above or below the long term moving average and if that blue average line is rising or falling. Recently the index has advanced above the moving average—a good first step. We also double-check the indexes’ long term momentum (KST in bottom panel). KST is a momentum oscillator our firm developed based on the smoothed rate-of-change of several different time frames. It is a helpful tool in identifying important long term turning points in any number of asset and security prices. Most recently, long term momentum is turning up from an oversold level for just the third time in the last dozen years or so, which is an encouraging sign. No long-term model can give precise timing signals, but our observation is that major turning points often take time to develop—sometimes over a period of months. Note how the price upturns in early 2003 and 2009-2010 took a number of months to progress. This bullish backdrop is also supported by one of our business cycle models, the Inflation Barometer, which went bullish in May, indicating a friendlier environment for inflation sensitive investments. These models all point out the timeliness of owning high quality energy companies.
Retirees hire us to become their investment advisor because we always strive to build several layers of risk protection into portfolios. Our investments in high quality energy companies provide an excellent example of our multi-faceted approach in action. Investing is most often not a matter of instant gratification, as value investors are rewarded over time, a process in which prices move on a long journey from undervalued levels to overvalue. Having experienced many investment cycles across all financial markets, any bottoming process is best taken advantage of by a careful accumulation of shares as the technical evidence improves.
We do confess that we may have a special fondness and familiarity with Chevron and its management, considering our office is located in Walnut Creek, California halfway between their Richmond refinery and corporate headquarters in San Ramon. Indeed, we have helped a number of Chevron retirees (some have been clients more than 30 years) enjoy their years after employment. Biases aside, have no doubts: Chevron and other high quality oil companies have survived many lesser challenges than those facing the industry today. We advise looking past the short-term cycle and negative publicity to rather analyze the history of boom and bust cycles in the oil patch and look for long term investment opportunities.
Thank you for reading.
DISCLOSURES:
A number of Pring Turner Capital Group clients own shares of Chevron (CVX).
Pring Turner Capital Group (“Investment Advisor”) is a fee-only financial advisor based in Walnut Creek, CA. The investment advisor invests on behalf of individuals, organizations, and other financial advisors that appreciate a conservative and active investment style that aims to deliver consistent results without taking undue risk. The key objective of the investment advisors philosophy is to not lose big during major market declines, making it easier to compound wealth over the long run.
The fee-only Investment Advisor is registered with the U.S. Securities and Exchange Commission. The views expressed herein represent the opinions of the Investment Advisor, are provided for informational purposes only and are not intended as investment advice or to predict or depict the performance of any investment. These views are presented as of the date hereof and are subject to change based on subsequent developments.
In addition, this document contains certain forward-looking statements which involve risks and uncertainties. Actual results and conditions may differ from the opinions expressed herein. All external data, including the information used to develop the opinions herein, was gathered from sources we consider reliable and believe to be accurate; however, no independent verification has been made and accuracy is not guaranteed. Neither the Investment Advisor, nor any person connected with it, accepts any liability arising from the use of this information. Recipients of the information contained herein should exercise due care and caution prior to making any decision or acting or omitting to act on the basis of the information contained herein. ©2016 Pring Turner Capital Group – Fee-only Investment Advisor Walnut Creek, CA. All rights reserved.