The chart of the month (below) compares the 10-year U.S. Treasury yield to its 12-month ROC. This oscillator is like a pendulum of a clock as it is continually swinging between an overstretched overbought +25% reading to a -25% oversold one. The arrows demonstrate that once it reaches -25% and then reverses, odds suggest that the yield is headed higher. A rise for yields would lead to a drop in bond prices as the two series move inversely. We don’t know where the low in the ROC will develop because its trajectory is still downward. However, what we do know, is that when it does turn, there will be very high probability that the next primary bull market for yields (bear market in bond prices) will already be underway. That’s an important piece of information to have!
Bond Pendulum Set to Swing Yields Higher
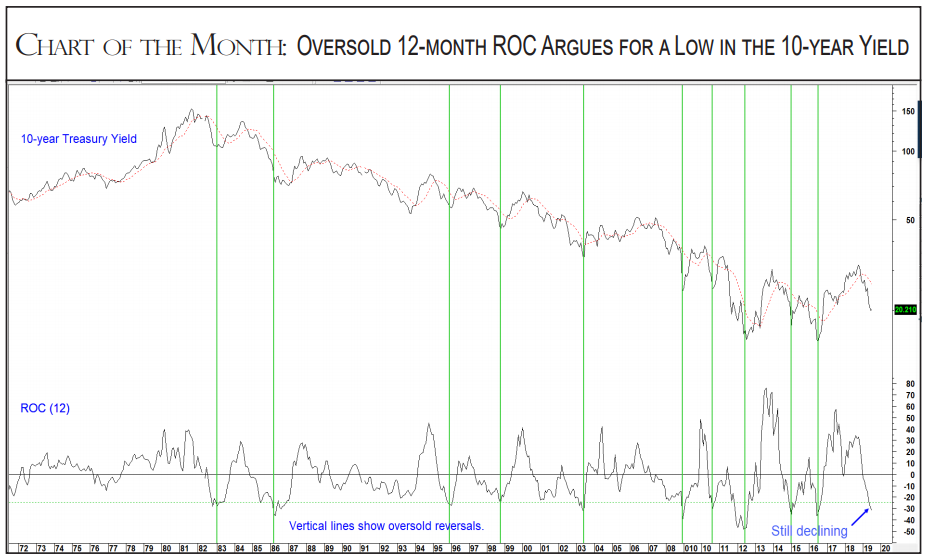
Source: Martin Pring’s InterMarket Review
Could we be at a key reversal point? In the chart below, the iShares 20-Year Trust (U.S. Bond ETF) experienced a key reversal on August 7, 2019. A key reversal develops after a sharp rally as buyers become exhausted. Consequently, buyers are very in much control coming into that session, as they cause the price to gap up at the opening. By the end of the session, though, sellers hold sway, as the price closes close to where it closed the previous day. High volume accentuates such action, as many traders go home trapped at higher prices. These key reversals are a rare phenomenon, but, when they develop, they often occur at major turning points. If bonds and stocks continue to move in opposite directions, that should be bullish for stocks. Stay tuned!
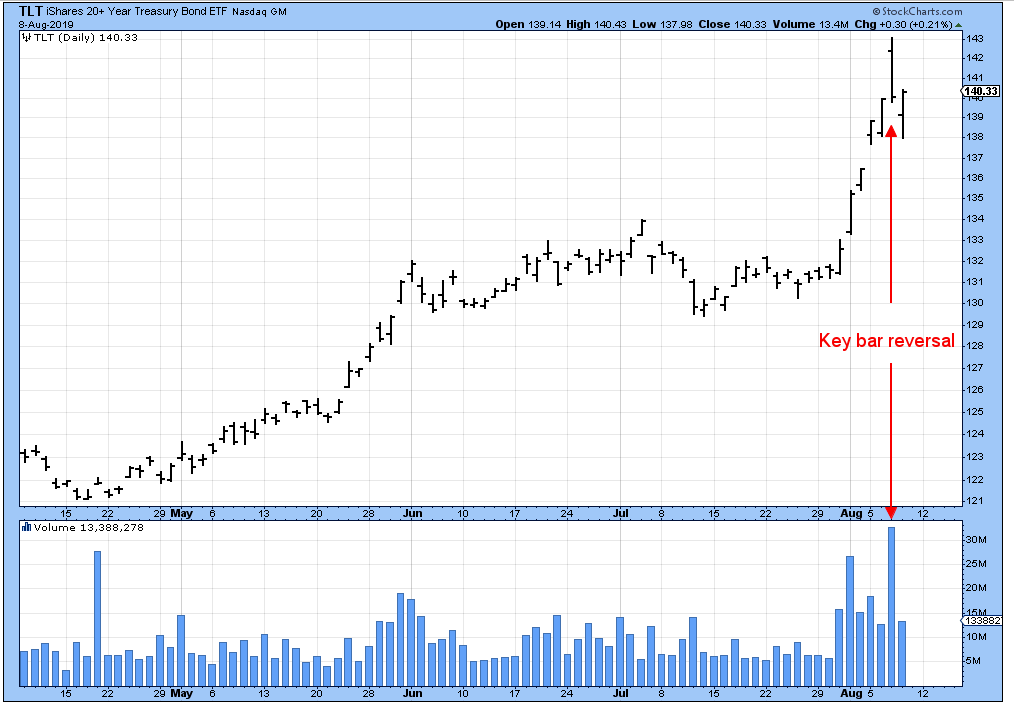
Source: Stockcharts.com
Photo by Jeremy Bishop on Unsplash
Disclaimer: The views expressed herein represent the opinions of the Investment Advisor, are provided for informational purposes only and are not intended as investment advice or to predict or depict the performance of any investment. These views are presented as of the date hereof and are subject to change based on subsequent developments. Neither the Investment Advisor, nor any person connected with it, accepts any liability arising from the use of this information. Recipients of the information contained herein should exercise due care and caution prior to making any decision or acting or omitting to act on the basis of the information contained herein.
Disclaimer: Pring Turner is a Financial Advisor headquartered in Walnut Creek CA, and is registered with the Securities and Exchange Commission under the Investment Advisers Act of 1940. The views represented herein are Pring Turner’s own and all information is obtained from sources believed to be accurate and reliable. This information should not be considered a solicitation or offer to provide any service in any jurisdiction where it would be unlawful to do so. All indices are unmanaged and are not available for direct investment. Past performance does not guarantee future results.
Continue Reading
Articles filed under Martin Pring's Technical Corner
Five Charts that Make the Case for a Bull Market in Commodities
December 8, 2020 - A year ago, as the economy was emerging from its third slowdown following the financial crisis, commodity prices looked set to move higher. However, due to the pandemic lockdown, the global economy abruptly fell into recession and commodity prices quickly... Continue Reading
Five Reasons for Being Bullish Despite a 60% Advance
September 8, 2020 - The S&P Composite has rallied close to 60% since late March, making a historic and remarkable round trip in a short period of time. You would think that after such a move it would make sense to anticipate a significant... Continue Reading
The May Employment Report was a Blowout but What’s Next?
June 9, 2020 - Where Have We Been? Back in February the stock market registered new highs. At the same time, several of the leading indicators we follow were tentatively signaling the emergence of the economy from its third growth slowdown since the financial... Continue Reading
Economy Drops at an Unprecedented Rate but Could be Close to an Upside Reversal
May 7, 2020 - Chart 1 below compares the S&P to our Master Economic Indicator (MEI). It combines the momentum of six leading economic indicators and comes into its own when economic activity causes it to drop below the -40% level and then moves... Continue Reading
Our Business Cycle Work is Close to signaling a Stage III. Guess Which Market That’s Bullish for?
January 6, 2020 - A large part of the Pring Turner investment approach is derived from the fact that the business cycle is nothing more or less than a repetitive chronological sequence of events. The cycle begins with a bottoming in the interest sensitive... Continue Reading