
Summary
This update focused on the challenges facing investors. Retired investors are especially challenged to both protect and grow their portfolios in today’s low return world. We started by highlighting the dual challenges of high stock market valuations coupled with record low interest rates. The current starting point today of near record high equity valuations points to low future investment returns. Investors and savers are also challenged by the fact yields have never in America’s 240 year history been as low as they are currently!
Martin shared his analysis of the economy and financial markets. He likened the economy to an auto race, where the driver had just finished a pit stop, was refueled and moving back on to the racetrack again. Implications of an economic “second wind” mean an improving stock market, higher interest rates (lower bond prices) and higher inflation.
Joe addressed how these observations affect portfolios. Economically sensitive companies in the industrial, machinery, and chemical industries have been added. Longer maturity bond positions have been reduced and will be replaced with shorter maturity bonds.
Tom reviewed the many, many investment challenges the firm had faced and met during its 40 year history. He further illustrated several risk management tools the firm incorporates into the decision making process that protects portfolios in rough times and grows portfolios in the good times.
Pamela, our new office manager, discussed very critical information concerning cybersecurity and the importance of making sure your estate and contingency plan are up to date. She further explained how Pring Turner can help coordinate efforts with your legal advisor and next generation.
We hope you appreciate reviewing the slides and notes in this summary update!
Investors, savers and especially retired investors find themselves in the proverbial position between a rock [lower expected returns] and a hard place [higher cost of living]. One example of low returns is in the bond market. Never in 5000 years of recorded history have investors had to deal with negative interest rates, but it is a fact today. An astounding 47% of global interest rates are in negative territory. Remarkably, savers pay the bond issuer to hold their money! Also 80% of bonds pay investors under 1% and a full 96% of all global bonds pay less than 2%. Purchasing a ten year U.S. government bond today locks in a paltry 1.58% for the next ten years….that is one reason why we suggest investors lower their expectations for future investment returns.
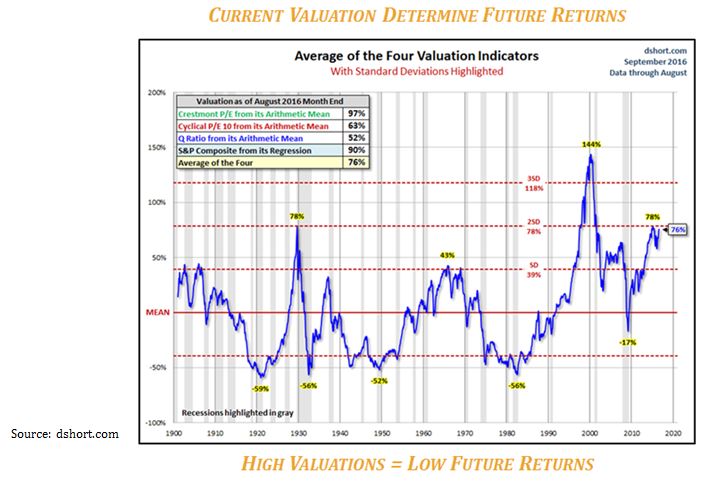
For stocks, investors should also lower their return expectations. Present valuation measures determine future long term returns. If valuations are low, then future returns promise to be substantial. If valuations are high, as they are today by most any measure, then returns will be more meager in subsequent years. Passive index investing, also known as “buy and hold” investing will likely prove to be both a frustrating and disappointing experience in the years ahead. Active investing or active asset allocation holds the potential to generate better investment results and eventually will return to favor with investors. The typical Pring Turner client, during the decade starting in 2000 where stock valuations travelled from starting 144% above mean level to ending the decade near 17% under mean valuations still earned solid returns with nearly half the market risk. With similar starting conditions today we understand the challenges ahead and optimistically look forward to protecting and growing your wealth in the future.
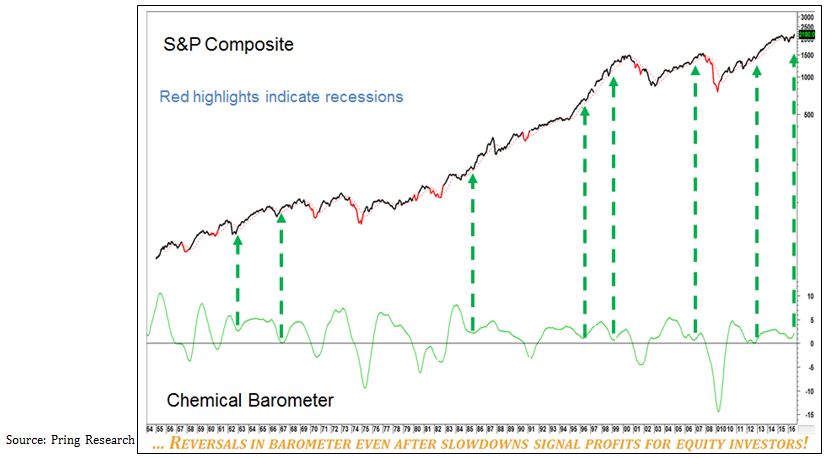
During a race, a racing driver needs a pit stop to re-fuel every so often. This is a necessary forced rest in order to continue the race. The stock market and economy are no different, every so often they need a pit stop to refuel and extend the cycle. After a nearly two year slowdown in economic growth and a relatively range bound stock market, we are encouraged by recent strengthening in a number of gauges including a reliable economic indicator, the Chemical Activity Barometer. The top half of the chart shows the S&P 500 with red highlights indicating recessions. The bottom panel depicts the momentum of the Chemical Barometer, a leading economic indicator published by the American Chemical Council. Each time this indicator falls below zero the U.S. experienced a recession. The only exception was 2002, when the economy recovered but the S&P 500 (at the time heavily weighted with tech stocks) was still crying the blues over the unwinding of the tech bubble. Today, momentum in this indicator is turning up from just above the zero line signaling renewed economic growth and stock prices are likely to strengthen once again. In other words, the economy has experienced a slowdown in growth and taken a pit stop to refuel. In the past such reversals in Chemical Barometer momentum have led to further gains in the stock market.
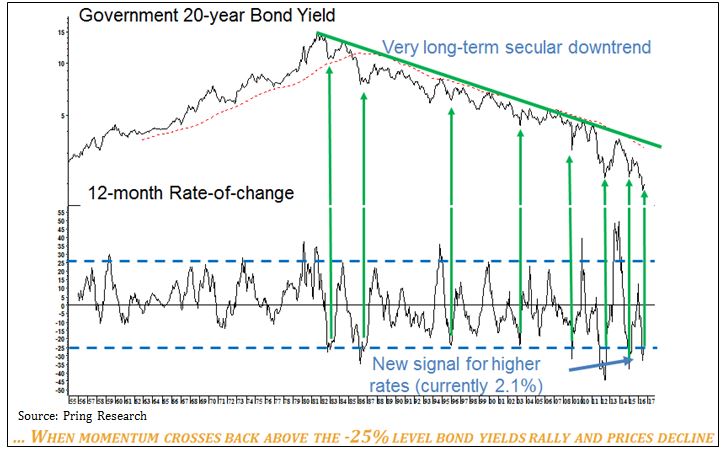
U.S. Treasury yields have been falling since September 1981. That is what we call a very long-term or secular decline in yields which translates to a secular bull market in bond prices the last 35 years. From the peak of 15% yields back then all the way down to only 2.1% rates today, a truly historic time period! The bottom panel shows the 12 month rate-of-change (ROC) for U.S. Treasury bond yields. Yields are like elastic. If they stretch too much one way we should expect a strong movement in the other direction. The ROC is our way of representing the elastic. By establishing when it is overstretched and observing a reversal we get a timely signal that a new trend is under way. The green arrows near the -25% line represents where yields have been stretched too low and are likely to reverse higher. The clear message from this chart is to avoid longer term bonds for now because yields are likely to move higher and bond prices lower. This is certainly consistent with what we saw in the last chart which suggested the economy was about to re-accelerate after a temporary slowdown. With an improving economy and higher interest rates, inflation sensitive assets typically outperform. Let’s take a look at commodities next.
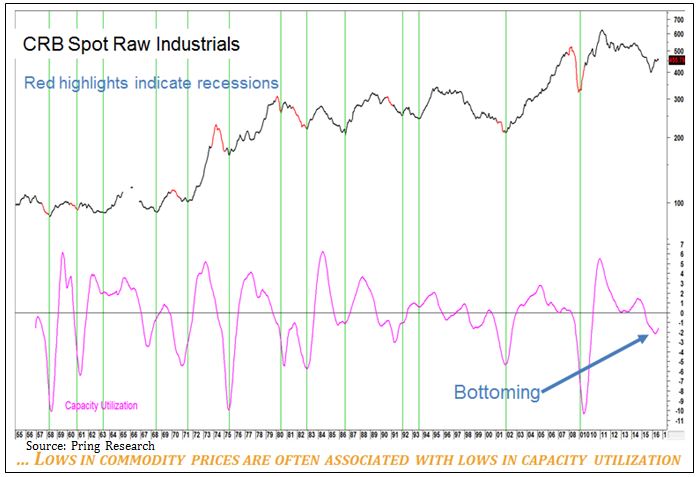
The top half of the chart is the CRB Spot Raw Industrial index reflecting only prices of industrial commodities. The green vertical lines flag the major commodity lows going back to the 1950’s. Industrial commodity prices are very much influenced by swings in the economy, so after several very weak years it is encouraging to see recent strengthening in this index. The bottom panel depicts the momentum of Capacity Utilization, an indication of whether manufacturing plants are either somewhat more idle or running at higher capacity. Recently this indicator has turned up and reinforces the case the economy is picking up speed and commodity prices will continue to strengthen. After a pit stop to refuel it’s time to re-accelerate! Putting all three slides together, economic growth is ready to improve giving stocks and commodities a favorable tailwind. Resource based companies in the energy, metals and industrial sectors are prime beneficiaries in this part of the cycle. On the other hand longer term bonds, which do poorly as inflation and interest rates rise are best avoided for the time being.
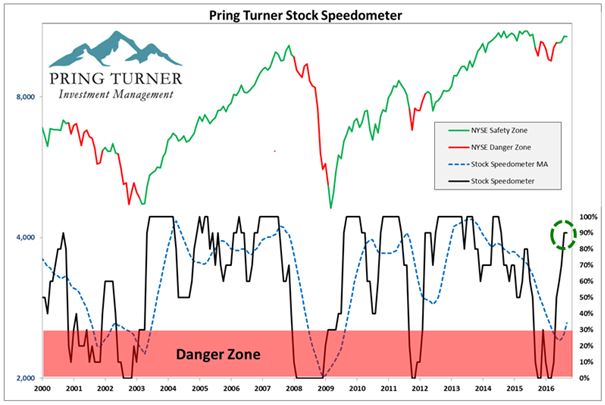
Reinforcing the positive view for stocks let’s turn our attention to Pring Turner’s Stock Speedometer, a portfolio management tool that combines a wide range of stock market indicators. Historically higher readings (maximum 100) have led to better returns for the average stock; conversely, lower readings (minimum 0) have led to poorer returns. The speedometer is designed to identify the primary environment of the stock market. Similar to your car speedometer, it signals us how fast or slow to safely drive your portfolio. As the Speedometer changes we make important portfolio adjustments in order to better navigate the financial road conditions ahead.
The Stock Speedometer has two crucial zones: a “Safety Zone” and a “Danger Zone”. Since 2000, the New York Stock Index (a broad proxy for U.S. Stocks) returned +12% per year on average with the speedometer in the positive or Safety Zone. In comparison, the New York Stock Index has dropped -21% per year on average with the speedometer in the negative or Danger Zone. Danger Zone readings do not come around very often (roughly ¼ of the time), but when they do it is imperative to execute a defensive investment game plan. The Speedometer is an excellent new tool that builds on the decades long research work to manage market risk for even better risk-adjusted portfolio returns.
The latest reading for the Stock Speedometer is 90 and solidly in the “Safety Zone”. This is dramatically improved from late 2015 and early 2016 when it stayed in the “Danger Zone”. The latest reading gives us confidence to continue gradually adding positions to your portfolio.
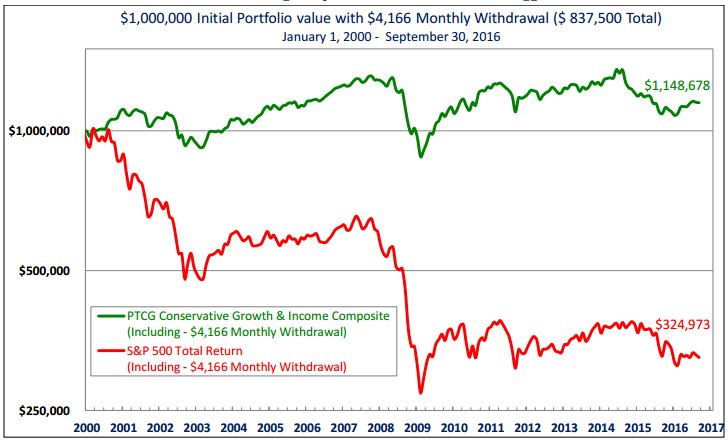
*Click the Image to see full performance report and disclosures*
The last 16 volatile years have shown plenty of cyclical ups and downs. For a buy and hold investor who is also a retiree taking out monthly withdrawals ($50,000 annually), it has been especially difficult. For example since 2000, $1,000,000 invested in the S&P 500 has dwindled to just under $325,000 (red line)–and there is still a need to withdraw $50,000 per year to meet retirement spending needs. On the other hand, the typical Pring Turner client (green line) has taken out the same withdrawals and protected the original nest egg with a current balance of just over $1,148,000. Our active investment strategy has outperformed passive or index investing approaches while taking roughly half the market risk. Your valuable nest egg and your income have been protected over the long run by Pring Turner’s pro-active conservative investment management. How did we outperform the market while taking less risk to secure your retirement? Let’s review three key Pring Turner disciplines used to mitigate risk.
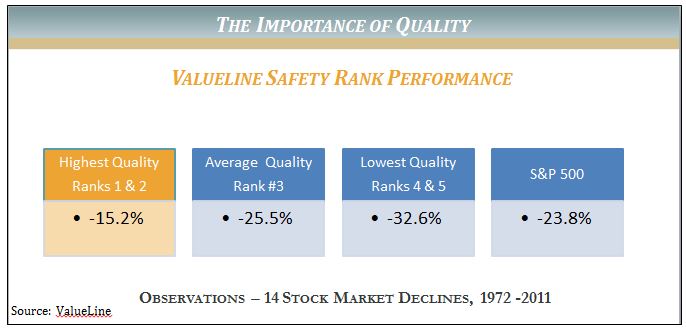
As a conservative investment advisor, we have always built many layers of risk protection into your portfolio, including our key components of quality, value and income. One criterion to assure your portfolio has the highest quality levels is to integrate ValueLine’s Safety Ranking into our decision-making process. ValueLine, founded in 1931, is a highly regarded independent investment research publishing firm. Their ranking system compares and combines balance sheet, financial strength and price stability to arrive at a safety ranking. Ranks of 1 and 2 are the highest quality and safety levels. Rankings of 3 are average, while safety rankings of 4 or 5 are below average for quality and safety. As shown in the table, historically the stocks with the highest quality rankings go down much less during significant stock market declines. We remain diligent in our efforts to emphasize the top safety rankings for you. You can sleep easier knowing the higher quality levels in your portfolio are structured to withstand challenging markets, allowing your portfolio to both generate consistent income and recover from market declines more easily. This is just one more example of how we build a portfolio with safety in mind. By the way, like you, we also like to sleep well at night!
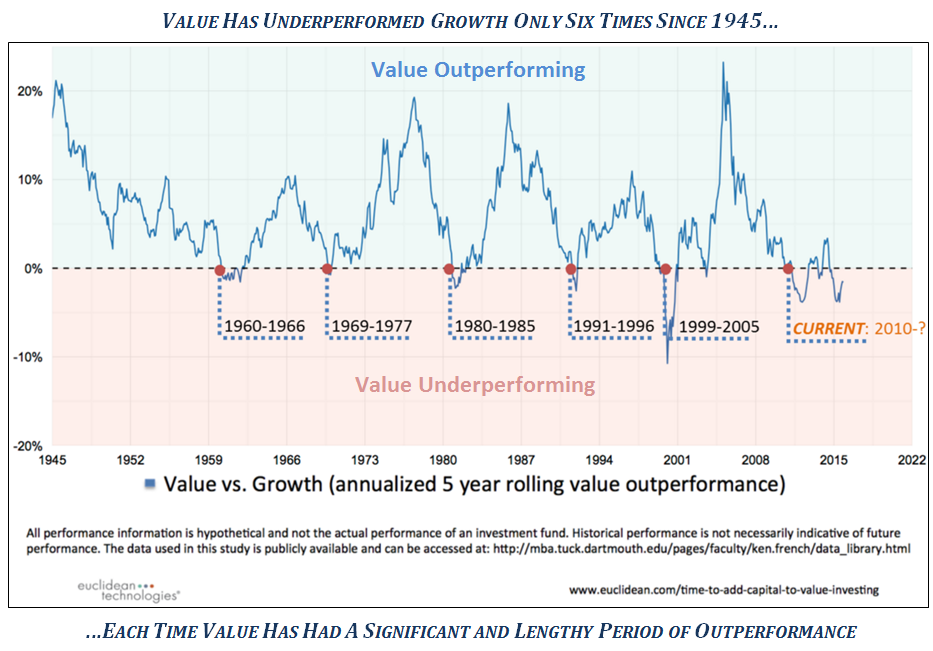
We could fill an entire library with academic studies that demonstrate a disciplined value approach gives far superior returns with less risk than a growth approach. In other words, growth gets the glamorous headlines, while value quietly gets the better results. Our clients’ long-term track records demonstrate that when you combine a playbook for both offense and defense, along with disciplined value investing, investors can achieve solid risk-adjusted returns. Of course, no investment approach is perfect and every few years we expect to encounter some rough patches. Even the most successful investment strategies will temporarily fall out of favor and their followers may lose patience. Such has been the case in recent years as value investing has experienced its longest dry spell in over 70 years. So, what can value investors expect looking forward? The chart compares these two investment styles and illustrates that every temporary period of under-performance for value vs. growth investing in the past 70 years has experienced a return to value’s pre-eminence with strong absolute and relative performance. We believe the environment today is quite similar to the early 2000’s following the dot.com bust when leadership changed and value stocks outperformed for a number of years. Evidence is building that value is starting to once again reassert its long-term dominance of roughly 5% annual out-performance. As value investors we can all look forward to a return to better results ahead.
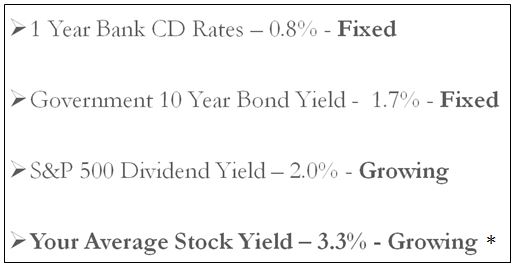
*Your Average Stock Yield – 3.3% Growing*: is the current yield of a typical Conservative Pring Turner Portfolio. Individual account yields could be higher or lower.
In today’s low return world we continuously search for ways to improve income in your portfolio. For instance, the current dividend yield for the S&P 500 index is roughly 2%. On the other hand, the dividend yield for stocks in the *typical Pring Turner portfolio average 3.3%, that’s roughly 2/3 higher than the broad stock index. Whether stocks go up or down it is nice to know that above average, dependable income from dividends flows into the portfolio providing a solid base of return. To further enhance portfolio income we will from time to time be incorporating a conservative strategy, covered call writing. Look for educational material to reach you soon and we stand ready to answer any of your questions regarding the strategy.
Summary
The main takeaway from this fall update is that the challenge investors face is lower future returns from both stock and bond markets. If history is a guide, these lower returns will be broken by intermittent rallies and declines. This means investors should have a game plan to both grow portfolios in favorable periods and take defensive steps in unfavorable markets. This is our proven formula to prosper during this challenging time.
Pring Turner has an organized and disciplined decision-making process that has been helping investors meet whatever challenges face them. The Pring Turner team has faced and successfully met recessions, stock market crashes, interest rates that reached the highest in U.S. history and the lowest rates in our history, along with real estate and technology bubbles and all along the way with both Republican and Democrat administrations. We are confident our experience and investment disciplines will deliver positive returns, no matter the challenges we all face.

A couple ways, among many, that Pring Turner goes beyond portfolio management for you is cyber security protection and contingency planning. In addition to the protection we provide for you there are a number of ways that you can protect yourself from fraudsters. It is vitally important to have a contingency plan for your affairs. We are always happy to work with you to ensure that you know your options and are prepared for any life event. We invite your next of kin and/or trusted friends to use us as a resource. That will ensure that they know who to call should anything ever happen to you.
Please be on the lookout for two newsletters that will provide you with more details on the topics of Cyber Security and Contingency Planning – coming this Fall.
Disclosures:
Pring Turner Capital Group (“Investment Advisor”) is an investment advisor based in Walnut Creek, CA. The Investment Advisor invests on behalf of individuals, organizations, and other financial advisors that appreciate a conservative and active investment style that aims to deliver consistent results without taking undue risk. The key objective of the Advisor’s investment philosophy is to not lose big during major market declines, making it easier to compound wealth over the long run.
The Investment Advisor is registered with the U.S. Securities and Exchange Commission. The views expressed herein represent the opinions of Investment Advisor, are provided for informational purposes only and are not intended as investment advice or to predict or depict the performance of any investment. These views are presented as of the date hereof and are subject to change based on subsequent developments.
In addition, this document contains certain forward-looking statements which involve risks and uncertainties. Actual results and conditions may differ from the opinions expressed herein. All external data, including the information used to develop the opinions herein, was gathered from sources we consider reliable and believe to be accurate; however, no independent verification has been made and accuracy is not guaranteed. Neither Investment Advisor, nor any person connected with it, accepts any liability arising from the use of this information. Recipients of the information contained herein should exercise due care and caution prior to making any decision or acting or omitting to act on the basis of the information contained herein. ©2016 Pring Turner Capital Group Walnut Creek, CA. All rights reserved.