
Chart 1 below compares the S&P to our Master Economic Indicator (MEI). It combines the momentum of six leading economic indicators and comes into its own when economic activity causes it to drop below the -40% level and then moves back above it. Such action earns a vertical green line, which usually coincides with the end of a recession. In 1970 and 1982 the indicator was slightly early. Previous crossovers have also represented great long-term buying opportunities for equities, 2001 being an exception. Note that once it reverses from an extreme downside reading, lost ground is regained very quickly, as there is no subsequent test of the low. April’s reading was a record, which indicates that the current rate of decline is unsustainable. Since an imminent turn is likely, downside economic momentum is close to maxing out.
The bottom window introduces a 9-month Rate of Change (ROC) of M2 (Money Supply), together with its 6-month Exponential Moving Average (EMA), in red. The relationship between the MEI and M2 growth is hardly precise, but there does appear to be a pattern of M2 growth preceding or directly following the end of a recession. The current ROC reading is at a record, so if M2 growth spills into the economy in the usual way, both it and stock market could experience a happy ending to 2020.
Chart 1 – S&P Composite and the Master Economic Indicator and M2 Growth
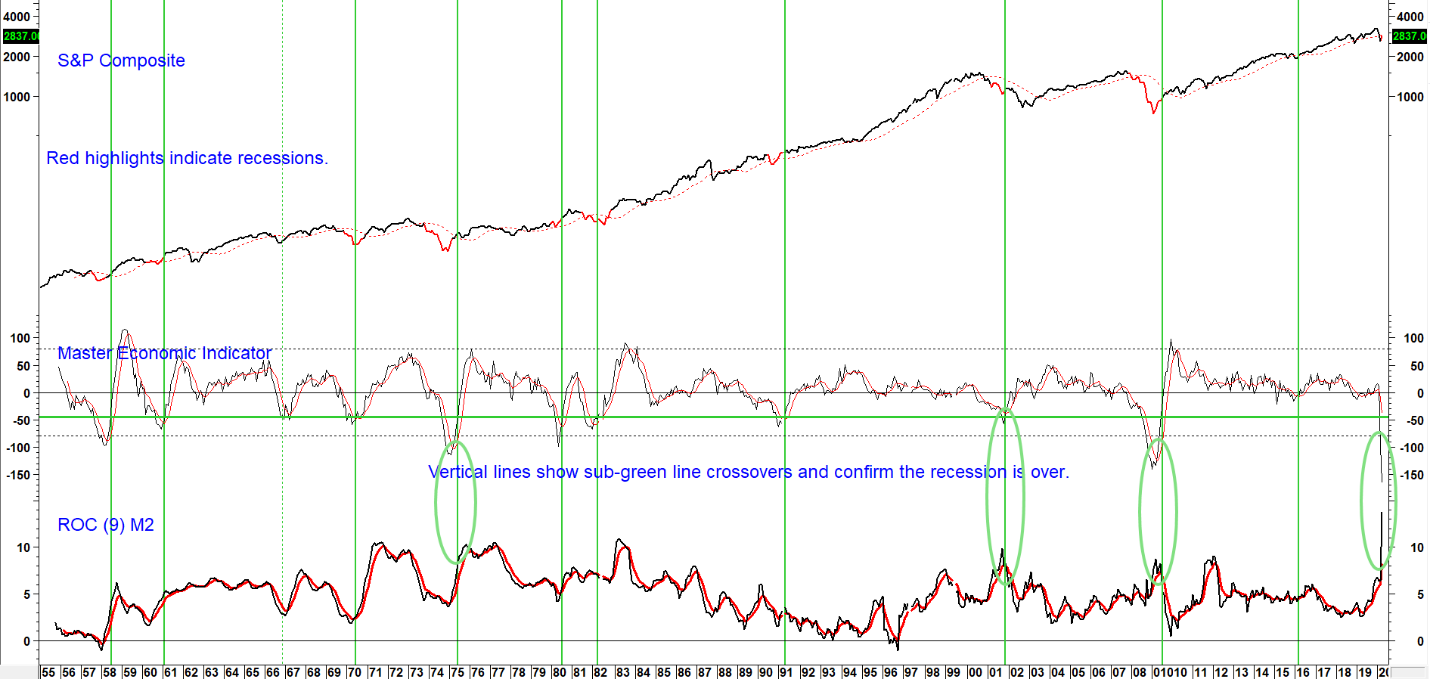
Source: Martin Pring’s Intermarket Review (click chart to enlarge)
The 10-year/1-year treasury yield curve offers a further indication of economic weakness (top panel in chart 2 below). It signals a recession when it first inverts, and subsequently steepens (i.e. moves away from inversion). The final requirement, is for the economy to confirm with our Pring Turner Recession Caller, a momentum indicator calculated from the Pring Turner LEI, falling below zero.
Chart 2 10/1-year Yield Curve and Two Indicators
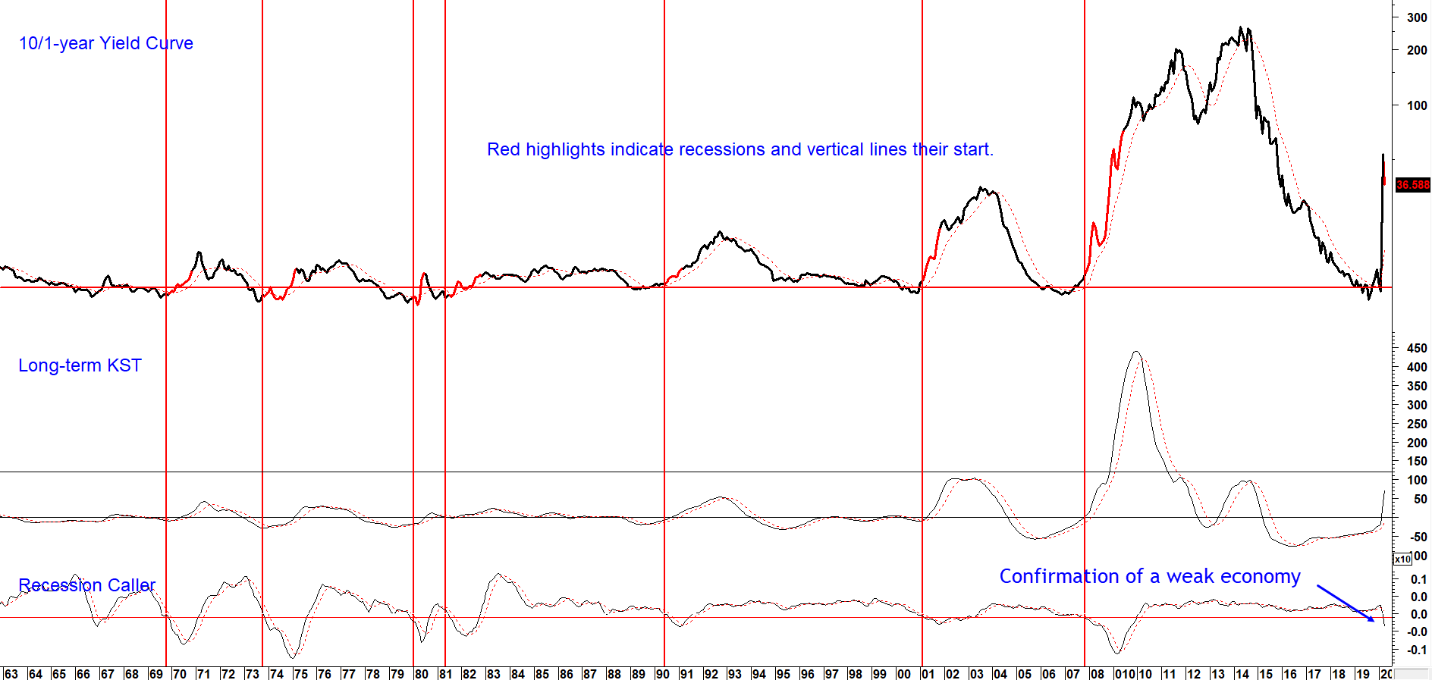
Source: Martin Pring’s Intermarket Review (click chart to enlarge)
All three conditions have been met, so thereby demonstrating that the economy is currently in a deep recession. The recently reported GDP figures at -4.8% also point in this direction, as does the recent 30 million or so jump in initial claims. We will continue to follow these indicators in future editions of the Intermarket Review. Don’t miss any updates. Click here to signup for our free newsletter.
Photo by Ussama Azam on Unsplash