
Where Have We Been?
Back in February the stock market registered new highs. At the same time, several of the leading indicators we follow were tentatively signaling the emergence of the economy from its third growth slowdown since the financial crisis. Along came the pandemically inspired lockdown and a sharp contraction ensued. Things changed so abruptly, that many normally timely business cycle leading indicators triggered signals well after the horse was out of the barn. The Chemical Activity Barometer (CAB), a unique LEI published by the American Chemical Council (Chart 1), reflects the three slowdowns that have taken place since 2009, and the achievement of a new high in January. The third slowdown, that began in 2018, actually morphed into a recession warning, when the indicator crashed through its 18-month moving average in March. The NBER on June 8 officially confirmed that a recession started in February.
Chart 1 – Chemical Activity Barometer and a Price Oscillator (1/24)

Economy moves abruptly into recession.
Source: Martin Pring’s Intermarket Review (click chart to enlarge)
The market and economy will recover. They always do. A large part of the Pring Turner investment approach is derived from the fact that the business cycle and financial markets are nothing more or less than a repetitive chronological sequence of events. Assuming May or June represented the low point, that raises the question; How long will it take it to return to the February high? No one knows of course, but with history as our guide, it’s not likely to happen any time soon. The answer for the stock market is already in so far as the NASDAQ is concerned, as that index recently registered an all-time high. In 1960,1980,1982 and 1990 the stock market touched a new high around the same time their respective recessions ended. Following the first three examples the market, on average, rallied for an addition 7-months without a meaningful correction. In the 1990 case it was almost 3-years.
The Economic Cycle is Bottoming
Chart 2 compares the S&P with our Master Economic Indicator (MEI), an aggregate series constructed from the momentum of several economic sectors. Its main claim to fame is calling the end of recessions and indicating major buying opportunities in the stock market. It does this through a two-step process. First, we get an indication that the economy is totally washed out, as it falls to or below the horizontal green trendline. Of course, it’s easy to spot these points with the benefit of hindsight. A more objective confirmation the second step involves the indicator re-crossing the line again. In doing so, it corroborates a bottoming of both economic momentum and equity prices. One exception, when stocks did not respond to changes in the economic environment developed in 2001; business activity recovered, but the market drifted lower due to the continued unwinding of the tech bubble.
Chart 2 S&P Composite and the Master Economic Indicator (MEI)
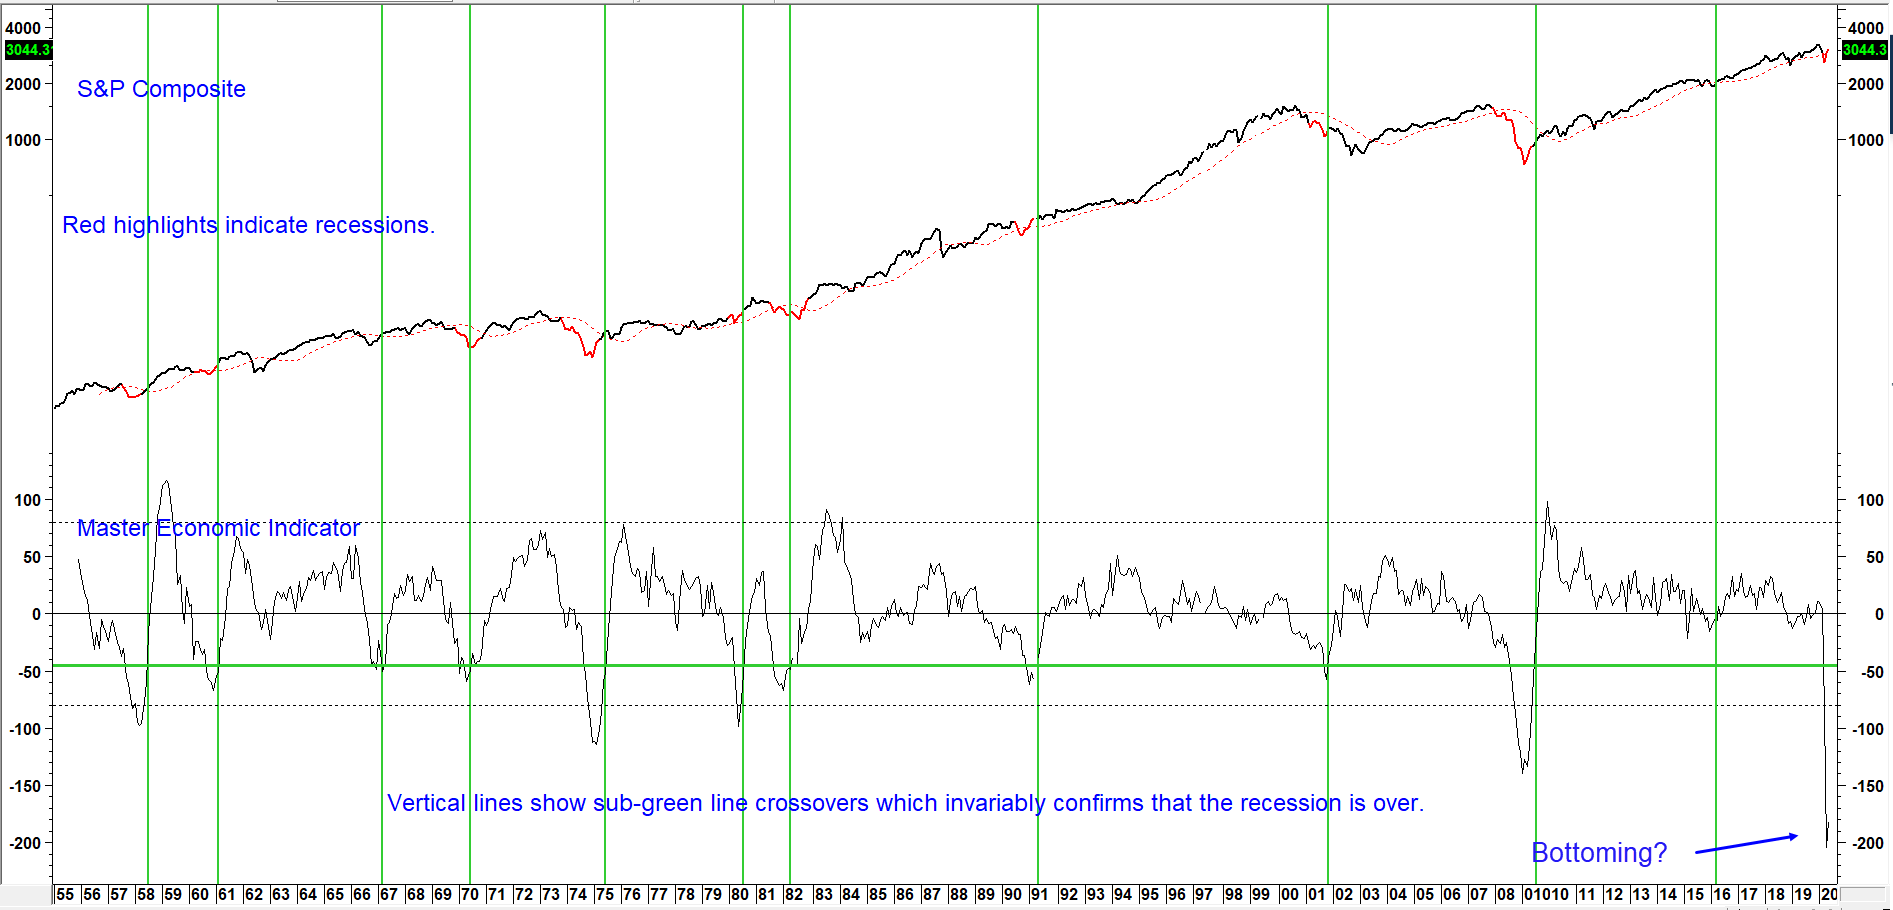
Unsustainable rate of decline argues for a quick reversal.
Source: Martin Pring’s Intermarket Review (click chart to enlarge)
The MEI is currently ticking up, following a record low in April. Since the economy is in the process of being “re-opened”, and trillions of dollars are being injected fiscally and monetarily, that small uptick probably signals that the unsustainable rate of decline is truly unsustainable! All of this suggests a short but deep recession, with the economy about to grow again.
A similar message is being telegraphed by the ratio between Nonfarm Payrolls and the Civilian labor Force (Chart 3). Neither component is included in the MEI, so there is no double counting. In this instance, the end of a recession is signaled when the price oscillator, in the lower window, bottoms out. Remember, it’s the momentum we are concerned about, not the actual turning points in the ratio. The latest data indicate a reversal in the price oscillator, but it is not yet decisive. This reversal will almost certainly will be confirmed, given the recently injected unprecedented monetary and fiscal stimulus in combination with further reduction and an eventual elimination of pandemic inspired lockdowns.
Chart 3 Nonfarm Payroll/Civilian Labor Force Ratio and a Price Oscillator (1/18)

Oscillator starting to turn up, a traditional sign of the end of a recession.
Source: Martin Pring’s Intermarket Review (click chart to enlarge)
Getting Back to Where We Were
Beginning a new recovery and expecting a quick return to February’s level of economic activity epitomized by a 3-4% level of unemployment are two different things. The National Bureau for Economic Research calculates that the trough to peak average for the 33 business cycles between 1854 and 2009 was 38.7-months, the lowest being 10-months in the early 1920.s, with 1982 being a close second at 12-months. Under that best-case scenario, and assuming that the economy (as opposed to its momentum) bottomed in May or June, we would be looking at a 10-11-month period, as the economy climbs back to its February peak some- time in the early part of 2021. A more likely scenario is something akin to the average since 1945, which was 58.4-months or close on 5-years.
Very Long-term Economic Momentum
That possibility of a substantial loss of very long-term upside momentum is reflected in the behavior of several economic indicators. Chart 4 for example, compares real retail sales to a deviation from its 96-month MA. Note that the trendline dating from the 1960’s was violated in 2008. Although the sales numbers subsequently advanced to record highs, they were never able to clear the extended trendline. In the last couple of months extreme weakness in the data has pushed it well below the line, almost back to its 2009 low.
Chart 4 Real Retail Sales and a Price Oscillator (1/96)
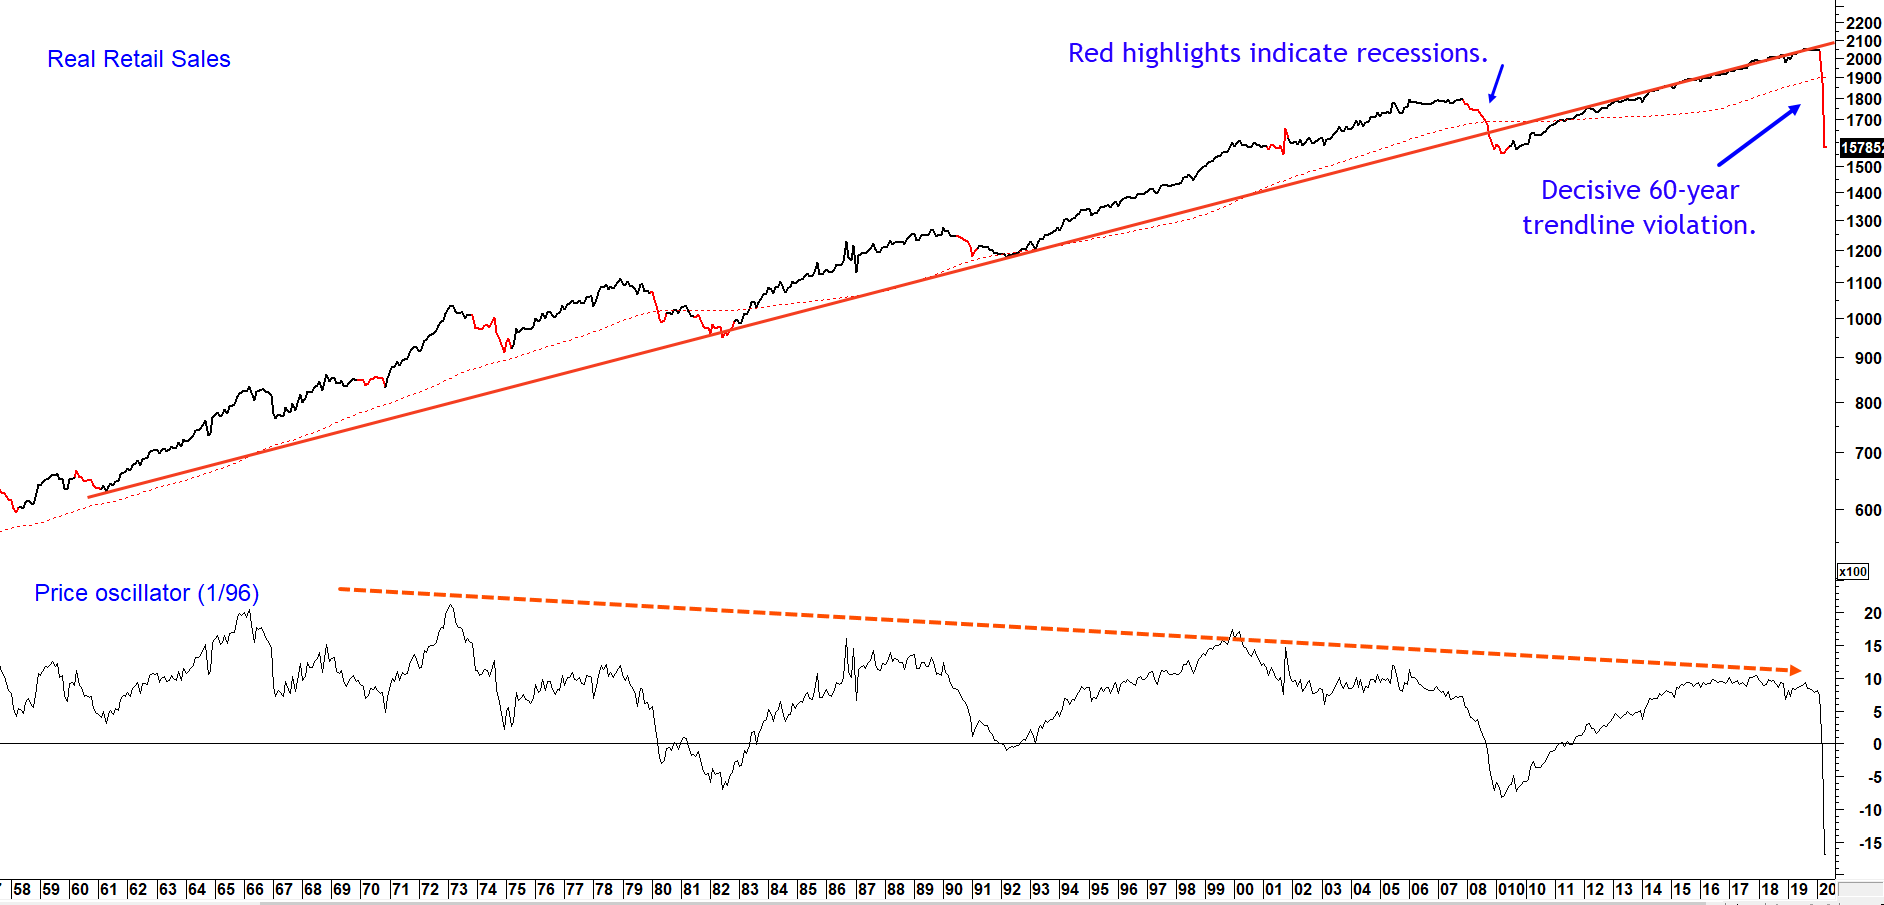
Long-term upside economic momentum is dissipating.
Source: Martin Pring’s Intermarket Review (click chart to enlarge)
This multi-decade trendline violation, combined with the series of lower peaks experienced by the price oscillator, suggests that it has experienced a serious loss of very long-term upside momentum, regardless of a likely favorable cyclical environment, say over the next 9-18-months. Remember, retail sales reflect the consumer, which represents 70% or so of the economy.
Historical Precedent
Periods of extended rangebound economic activity reflecting a transitional phase, are not unprecedented. The mid-late 1940’s and the 1978-1984 periods come to mind. The former experienced a transition from war to peace and the latter, from an inflationary to a deflationary environment. Both commodities and yields experienced secular peaks during that time frame.
Interest rates are currently close to record lows, commodities experiencing multi-decade weakness and M2 is expanding at stratospheric rates. Consequently, when velocity picks up an inflationary transition is a possibility. The re-shoring of jobs with the building of significant critical manufacturing capacity could very well accentuate the inflationary effects. We think an important re-adjustment of the economy is more likely to be influenced by an acceleration in remote working, learning, telemedicine and travel. Let’s not forget that the lockdown has physically demonstrated to previously skeptical institutions that remote working in many instances actually works, by saving money and enhancing productivity.
That’s certainly good news, but on the other side of this two-edged sword, other industries will find the need to adjust soon from a state of over-capacity. For example:-
- Reduced commuting will moderate the need for automobiles and office space.
- Webinars will aggressively compete with conferences, resulting in less demand for airlines and hotel services.
- Online learning will force institutions of higher education to be more competitive with their pricing. Perhaps not a problem for oversubscribed top tier schools, but certainly one for marginal ones.
- Online purchasing will continue to eat away at the business of brick and mortar stores, pressuring commercial real estate.
- Remote doctor visits and self-monitoring through transmission of data from home to medical facilities. Once again, less demand for travel, personnel and commercial real estate.
Perhaps the largest elephant in the room, apart from the drag of an on-going unprecedented accumulation of debt, emanates from the energy industry. Twenty years of production cuts aimed at elevating prices to artificial levels has fueled massive amounts of productive capacity, principally in the US. The price discovery process will eventually right the current over supply situation, but this is a long-term structural problem, not one that can be quickly addressed by a large inventory adjustment.
Conclusion
Always being alert and anticipating the next inflection point in the business cycle can help you actively manage your investments while taking advantage of emerging profit opportunities and more importantly protect your wealth from the inevitable cyclical declines. We are prepared to make timely adjustments to our investment portfolios to take advantage of this potential economic rebound.
Putting it all together, it seems likely that we are dealing with a short but sharp recession. The resultant recovery will initially look strong from a momentum point of view. That’s because the economy will quickly open up, egged on by the positive effects of record monetary, fiscal stimulus and over time with the reshoring of manufacturing jobs. On the other hand, long-term overcapacity in other key industries brought on by the disruptive effects of increased remote working, learning, meeting and shopping, will act as a challenge. In the meantime, enjoy the party.
We will continue to monitor the business cycle in future editions of the Intermarket Review. Don’t miss any updates. Click here to sign up for our free newsletter.
Photo by Clem Onojeghuo on Unsplash