Aging demographics, technological innovation and an ever -expanding debt overhang are three reasons why inflation has been largely kept under wraps in the last three decades. They are still relevant, so why not extrapolate a benign inflation trend into the future?
One reason might lie in the Fed’s extraordinary monetary easing, a by-product of which has been zero money market rates. Another might be record deficit spending as far as the eye can see. It just may be that this unprecedented stimulation will be sufficient to tip the long-term balance to a more inflationary one. Unfortunately, we are in uncharted waters on many fronts, so no one can really answer that inflation/deflation question with any degree of certainty. We can however, look to the technical condition of commodity markets for guidance, since they have usually, acted as a barometer for more generalized swings in inflationary and deflationary pressures.
Inflation is cumulative in the sense that the CPI almost invariably rises, only temporarily dropping during the odd recession. In that sense it’s never transitory. Our definition of sustainable as opposed to transitory inflation is an extended trend of annualized CPI growth, such as took place in the 1966-1970 period (see Chart 2).
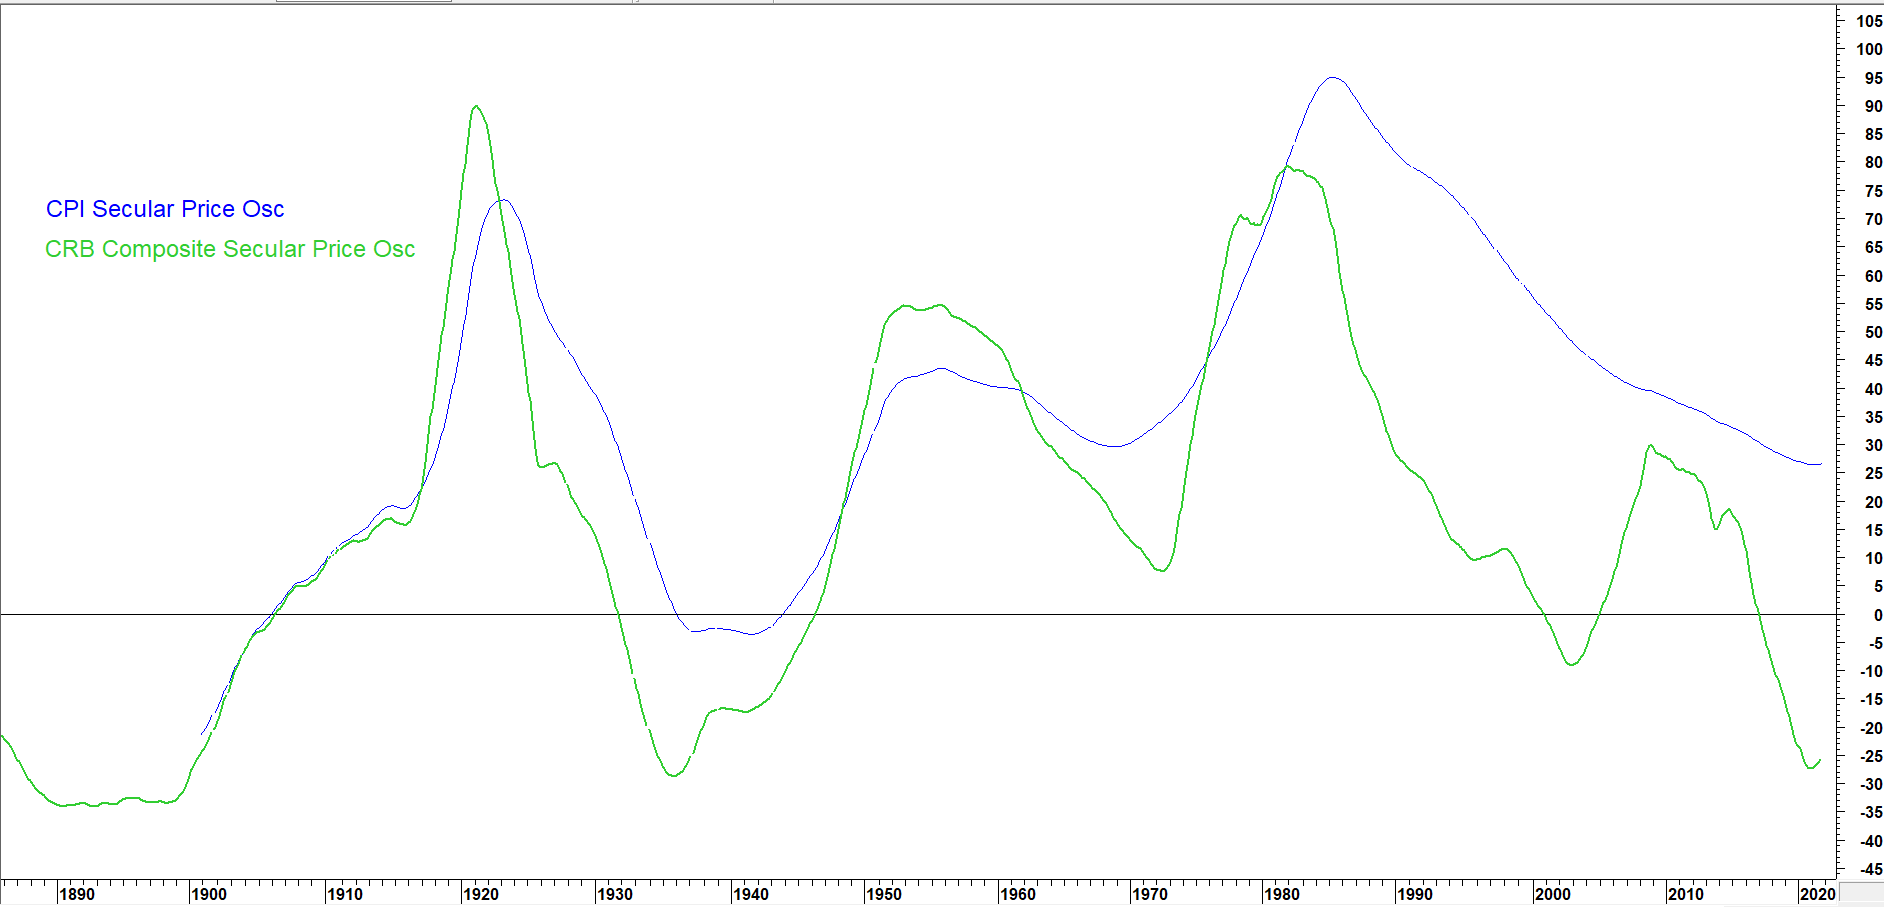
Chart 1 compares our secular price oscillator for commodity prices to a similar measure based on the CPI. Commodities generally take the lead at major turning points, with the notable exception of the 2002 rally, which was not reciprocated by the CPI. A smaller discrepancy also arose in the late 1990’s. The recent upside reversal in the commodity oscillator hints that it will not be long until the CPI, which has already started to edge up, follows suit with a reversal of its own.
Chart 1 -Secular Price Oscillators for Commodities and the CPI Compared
With the exception of the 2002-2011 period, commodity and CPI momentum have moved in a similar direction.
Source: Martin Pring’s Intermarket Review
Core Inflation Rate Breaking Trend
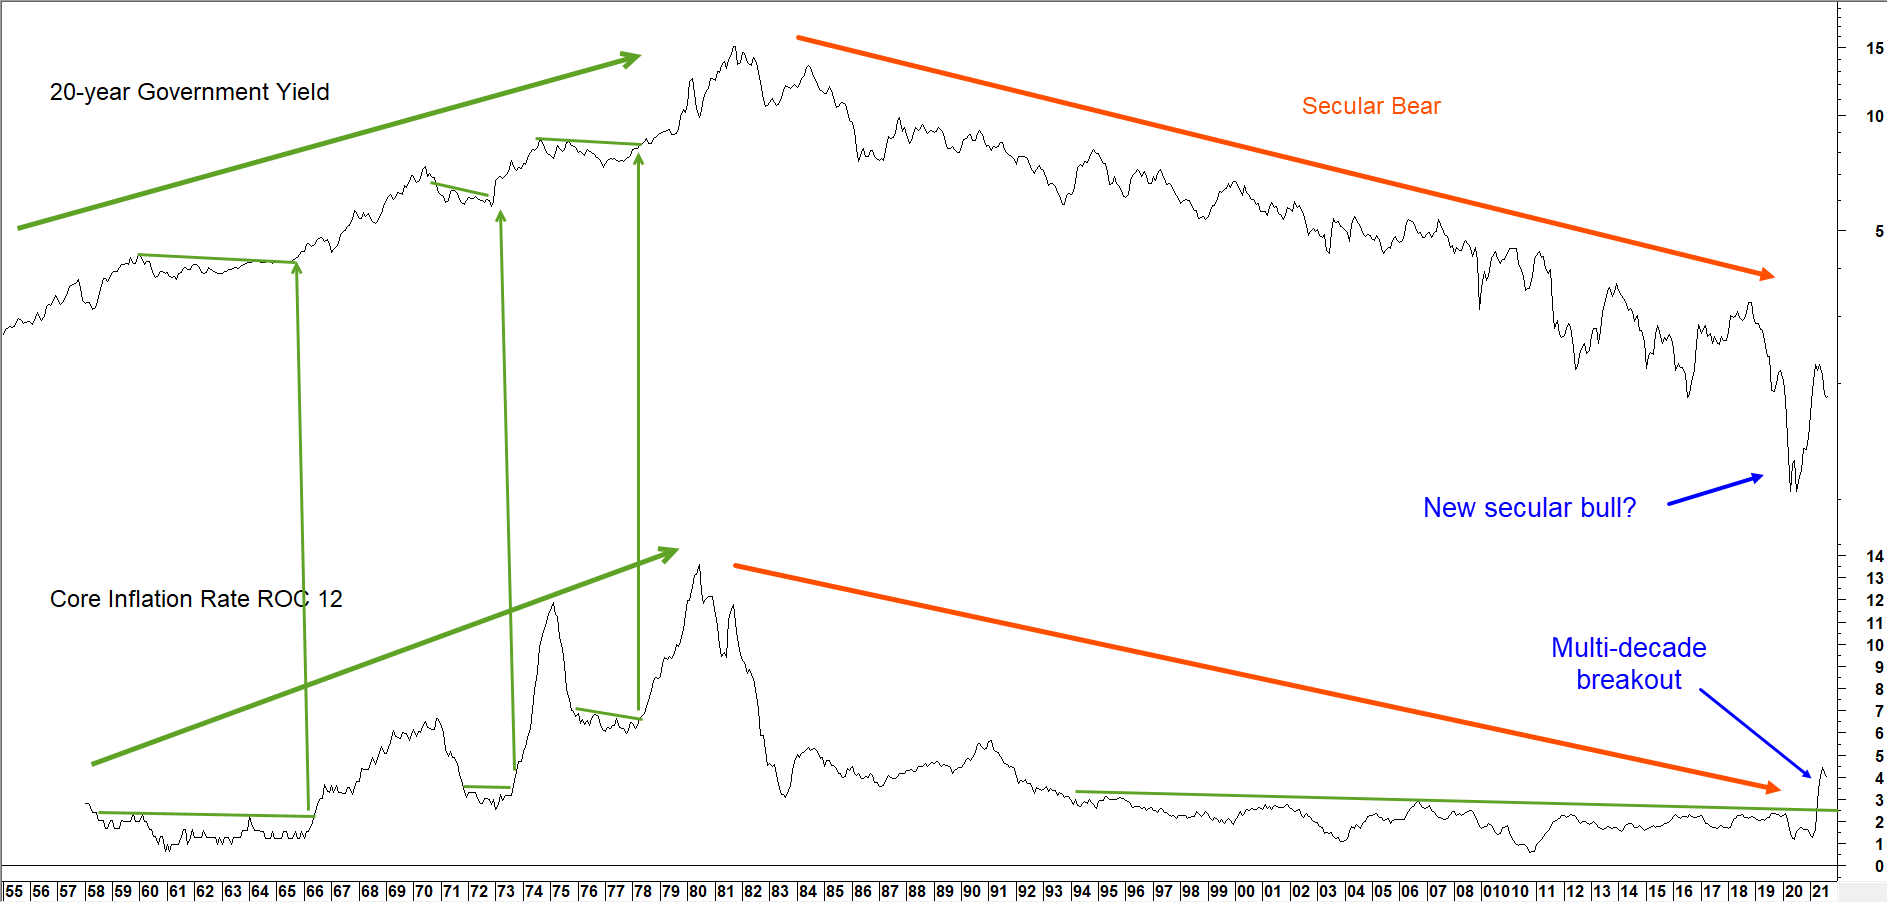
One event that could be defining, is April’s breakout in the annual core inflation rate above a 30-year trading range, as shown in Chart 2. Similar multi-year breakouts are not confined to the 12-month time span but can also be observed in longer-term time frames extending well in excess of 96-months (8-years). To us, that represents a warning sign that something fundamental has changed in the post 1981 “deflationary” environment.
Chart 2 Twenty-year Government Yield versus the Annualized Core Inflation Rate
Core inflation rate breakout suggests a trend of higher inflation and bond yields is underway
Source: Martin Pring’s Intermarket Review
The chart also shows the connection between long-term trends of the yield on 20-year government bonds and the annualized core inflation rate. The secular commodity bull market that took place between 2001 and 2011 did not disturb the secular downtrend in yields, as it did not spill over into the CPI in any meaningful way. However, the recent 30-year breakout indicated in the chart represents one piece of evidence of a reversal in the 40-year secular bear for yields should inflation not prove to be transitory.
Secular Commodity Price Movements
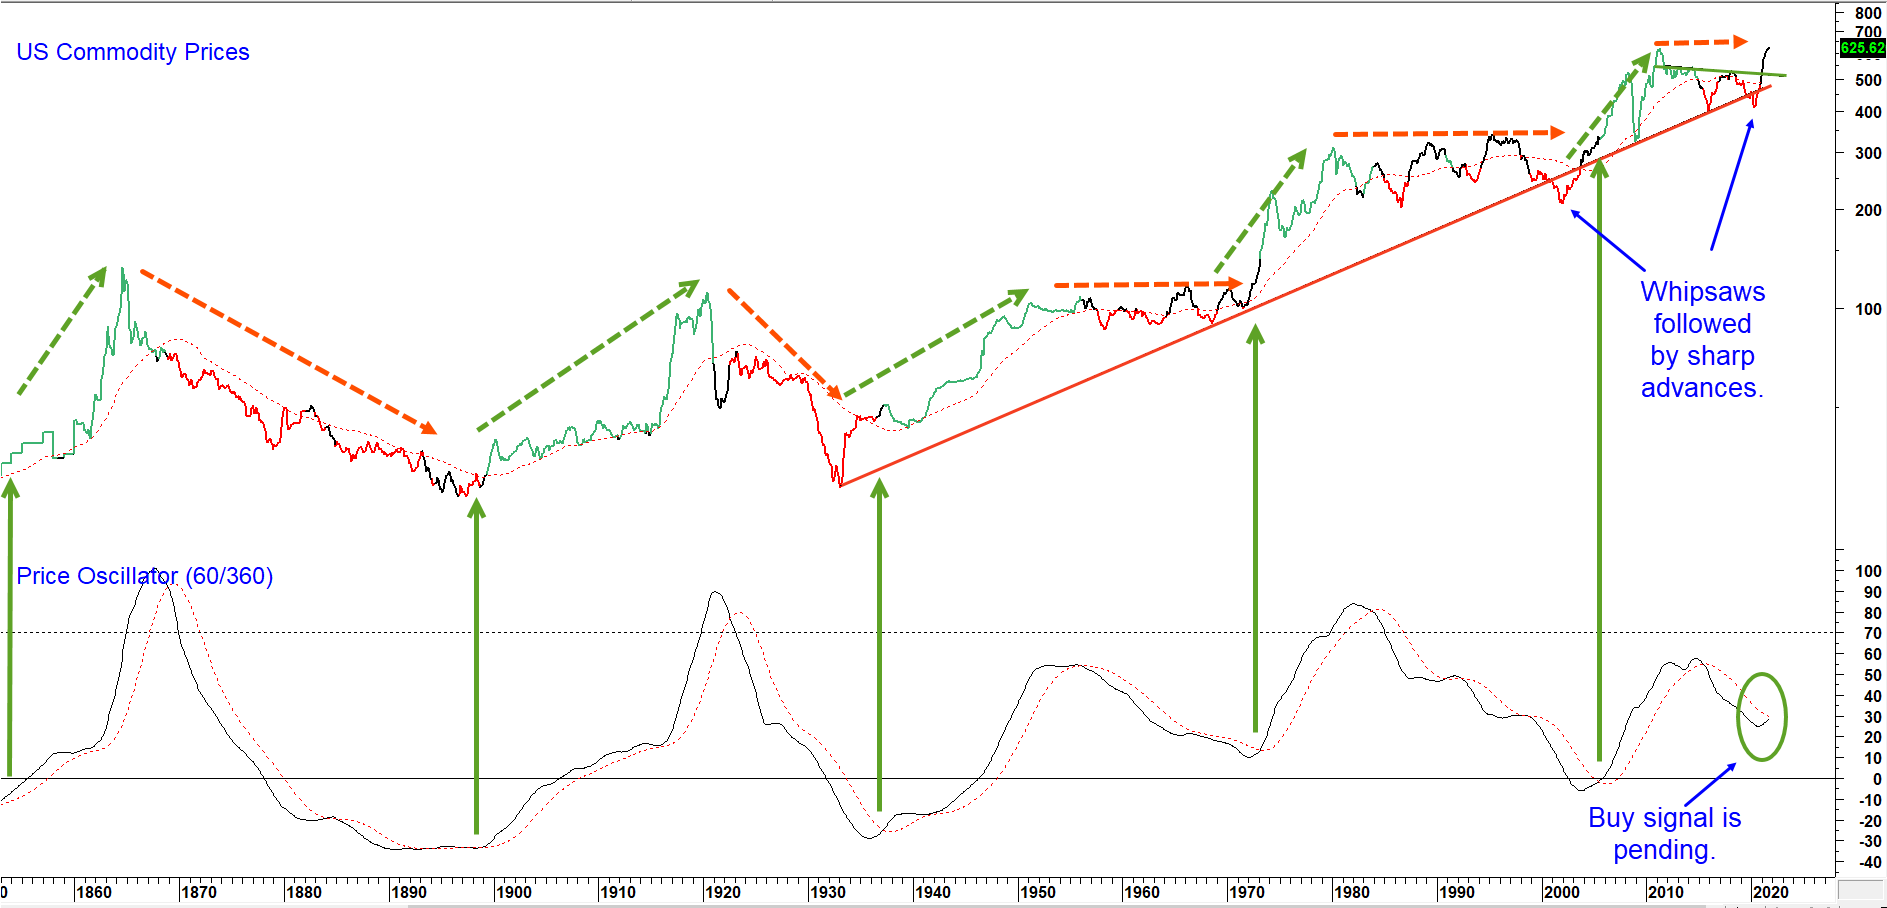
Trends in commodity prices have often given advanced warnings of a forthcoming more generalized inflationary environment. To set the scene, Chart 3 features the CRB Spot Raw Industrials. It has been spliced to US wholesale prices prior to the mid-twentieth century. The arrows above the index indicate the alternation of secular, or very-long-term, bulls and bears that have taken place since the middle of the nineteenth century. Note that “bear” markets often take the form of a trading range. Excluding the post 2008 period, these very long-term bull and bear trends have averaged 19- and 22-years respectively. The latest “bear” has taken the form of a 10-year trading range, which is brief by historical standards. If an inflationary outcome is to materialize, it is likely to initially show up in the form of a reversal in this secular trend and confirmation that a new super cycle bull market began last year.
The oscillator in the lower panel of both charts monitors these price movements and triggers secular buy signals when it experiences a positive crossover of its 48-month MA. Obviously, this approach does not offer tick by tick timing, but does provide valuable clues as to the direction and maturity of the secular trend.
Chart 3 CRB Spot Raw Industrials and a Secular Oscillator
Secular price oscillator getting close to a buy signal.
Source: Martin Pring’s Intermarket Review
This indicator has already started to turn up but has yet to cross decisively above its MA, thereby qualifying for a sixth secular buy signal since 1840. An examination of the price trend itself suggests a signal is likely. First, the 1933-2021 mega up trendline is intact. It was violated temporarily in 2001 and was followed by a very sharp rally, typical of post whipsaw action, as the bears struggle to get back to the right side of the market. The 2020 false break may well be followed by a similar outcome. Second, the Index recently completed an 8-year inverse head and shoulders pattern, not dissimilar to action seen in the early 1970’s. The indicated upside objective, if achieved, would take it well above its previous high, almost certainly triggering an oscillator buy signal.
By way of a back of the envelope measurement of breadth, we note that just over half of the commodities in our historical database have already triggered a similar secular price oscillator buy signal. Those bullish components are: corn, wheat, oats, cotton, copper, palladium, gold, lumber and silver. Crude oil is also very close to one as well.
M2 Growth from a Different Perspective
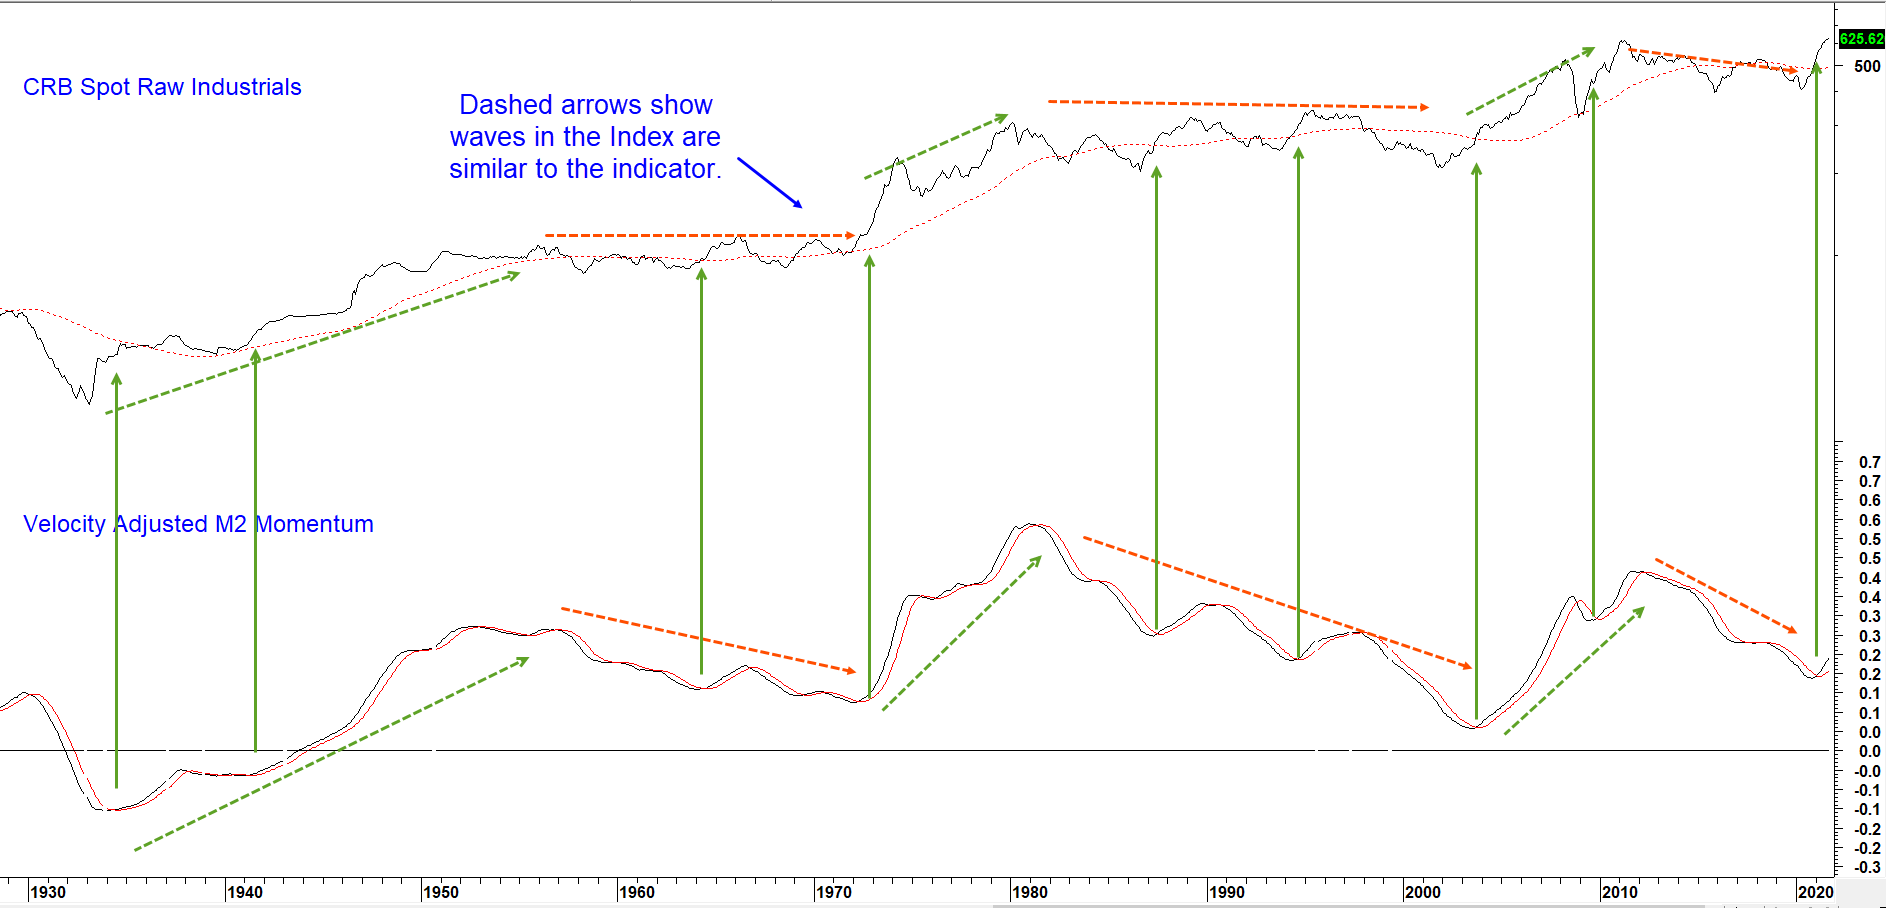
Milton Friedman told us that inflation is always and everywhere a monetary phenomenon. The trick is being able to time when sufficient money is being pumped into the system to cause inflation. If it is held in bank accounts or under beds, money does not have the same influence as if it is circulating at a faster clip. The series in Chart 4 takes M2 and adjusts it for fluctuations in its velocity of circulation. The raw data is then expressed as the momentum series in the lower window.
Chart 4 CRB Spot Raw Industrials and M2 Velocity Adjusted Momentum
M2 velocity adjusted momentum recently triggered its ninth decisive buy signal since 1930.
Source: Martin Pring’s Intermarket Review
It may be possible to debate the theory but there can be no mistaking the close relationship between this series and business cycle associated trends in commodity prices. In this respect, the dashed arrows flag the secular trends and the solid one’s periods when this price oscillator crosses decisively above its 10-month MA. There have been eight such signals since the 1930’s. All were followed by cyclical commodity bulls. These signals were especially strong when triggered during a secular up trend. April saw a ninth signal, which suggests prices are likely to extend their recent gains well into the future. If so, that would buy more than enough time to trigger that pending super cycle buy signal in Chart 3.
Conclusion
There is a loose but solid connection between commodity prices and major swings in the annualized CPI. Commodity prices look poised to signal a new secular bull market, which would likely broaden out to result in the highest more generalized inflation rates since the 1970’s.
If that proves to be the case, the implications for stock investors would be tremendous. One obvious effect would be an improvement in relative performance by earnings driven sectors, especially commodity sensitive ones. More importantly, history shows, that as secular commodity bull markets mature, their consequential economic distortions trigger secular bear markets for stocks in general. Passive investors will likely be frustrated as active investment strategies get their chance to shine during a prolonged rangebound market. But that’s another story for another article, stay tuned!


