The Pring Turner Leading Economic Indicator (LEI) comprises a weighted ROC for three key economic sectors and a financial one. These are construction, consumer spending, employment and the stock market. It has led every recession since its inception in the 1950’s. To be fair, it also signaled the non-recession of 1966. Signals are triggered by the “Recession Caller” in the lower window dropping below the red trigger line. The latest data point to the indicator moving away from that line in the direction of renewed recovery and away from a business contraction.
Source: Pring Research
The most severe stock market declines (-20% or more) have occurred during economic recessions. For retirees, it is especially critical to avoid recession-driven market declines in order to effectively secure a stable retirement lifestyle. Recovering from these big losses can be a difficult and highly stressful endeavor. This is one reason why we follow the natural rhythm of business cycle swings closely and stay on alert for major turning points in the economy.
What is the Pring Turner LEI telling us now? The following chart shows the most recent 20-year history of this forward-looking indicator, and how it peaked out and began a persistent decline a year or more before the last two recessions. This behavior is in contrast with today’s positive trend where the indicator just reached an all-time high! The latest reading suggests that there is low risk of a recession in the coming months. Continued economic strength typically translates into higher stock prices.
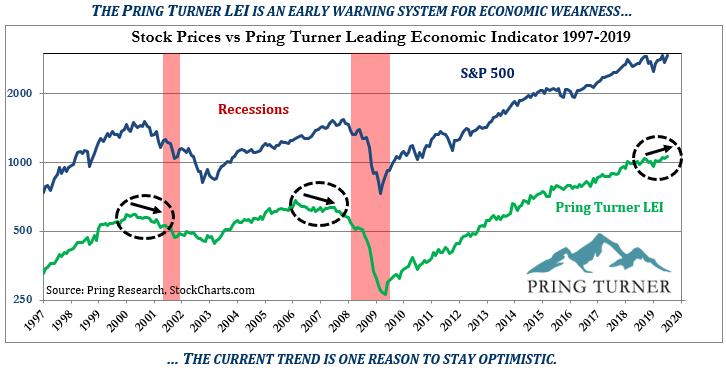
Photo by Samuel Zeller on Unsplash
Disclaimer: Pring Turner is a Financial Advisor headquartered in Walnut Creek CA, and is registered with the Securities and Exchange Commission under the Investment Advisers Act of 1940. The views represented herein are Pring Turner’s own and all information is obtained from sources believed to be accurate and reliable. This information should not be considered a solicitation or offer to provide any service in any jurisdiction where it would be unlawful to do so. All indices are unmanaged and are not available for direct investment. Past performance does not guarantee future results.
Continue Reading
Articles filed under Martin Pring's Technical Corner
The Bursting of the Tech and Bitcoin Bubbles—Part II
May 12, 2022 - In March of last year, I wrote an article entitled “Timing the End of the Tech and Bitcoin Bubbles”. The conclusion for Bitcoin was that it was indeed in a bubble but that there was insufficient technical evidence at the... Continue Reading
Burglar or Bank Robber? Time to Watch Your Wallet and Stock Portfolio!
March 21, 2022 - In October 2021, we made the case for a new secular commodity bull market and concluded that this environment would likely spill back into the economy and stock market. That process is already underway, as the NASDAQ Composite was recently... Continue Reading
Impending Super Cycle Commodity Signal Argues Against Transitory Inflation
October 18, 2021 - Aging demographics, technological innovation and an ever -expanding debt overhang are three reasons why inflation has been largely kept under wraps in the last three decades. They are still relevant, so why not extrapolate a benign inflation trend into the... Continue Reading
Five Charts that Make the Case for a Bull Market in Commodities
December 8, 2020 - A year ago, as the economy was emerging from its third slowdown following the financial crisis, commodity prices looked set to move higher. However, due to the pandemic lockdown, the global economy abruptly fell into recession and commodity prices quickly... Continue Reading
Five Reasons for Being Bullish Despite a 60% Advance
September 8, 2020 - The S&P Composite has rallied close to 60% since late March, making a historic and remarkable round trip in a short period of time. You would think that after such a move it would make sense to anticipate a significant... Continue Reading