Holy cow! This economy is on fire; witness the second quarter U.S. GDP growth rate of 4.1%. Is it sustainable or a just a temporary spurt? It’s often said that the Copper price has a PHD in economics, because of its widespread use in many diverse industries. That use ranges from homes, factories, and electronics, to power generation and transmission and much more. As a result, swings in demand and therefore price, give it a leg up when it comes to economic forecasting. In general, rising demand is reflected in higher prices and a growing economy, and shrinking demand lower prices and weaker economic growth. Based on a fairly consistent track record over the last several decades, the current copper price trend is pointing to an impending global economic slowdown. Perhaps that 4.1% GDP growth rate for the quarter will not be sustained after all. Whether the approaching global growth slowdown morphs into an actual recession is unclear right now; it’s a bit too early for a call on that. But let’s review the current behavior of Dr. Copper to give us some historical clues that may help guide appropriate portfolio risk management decisions.
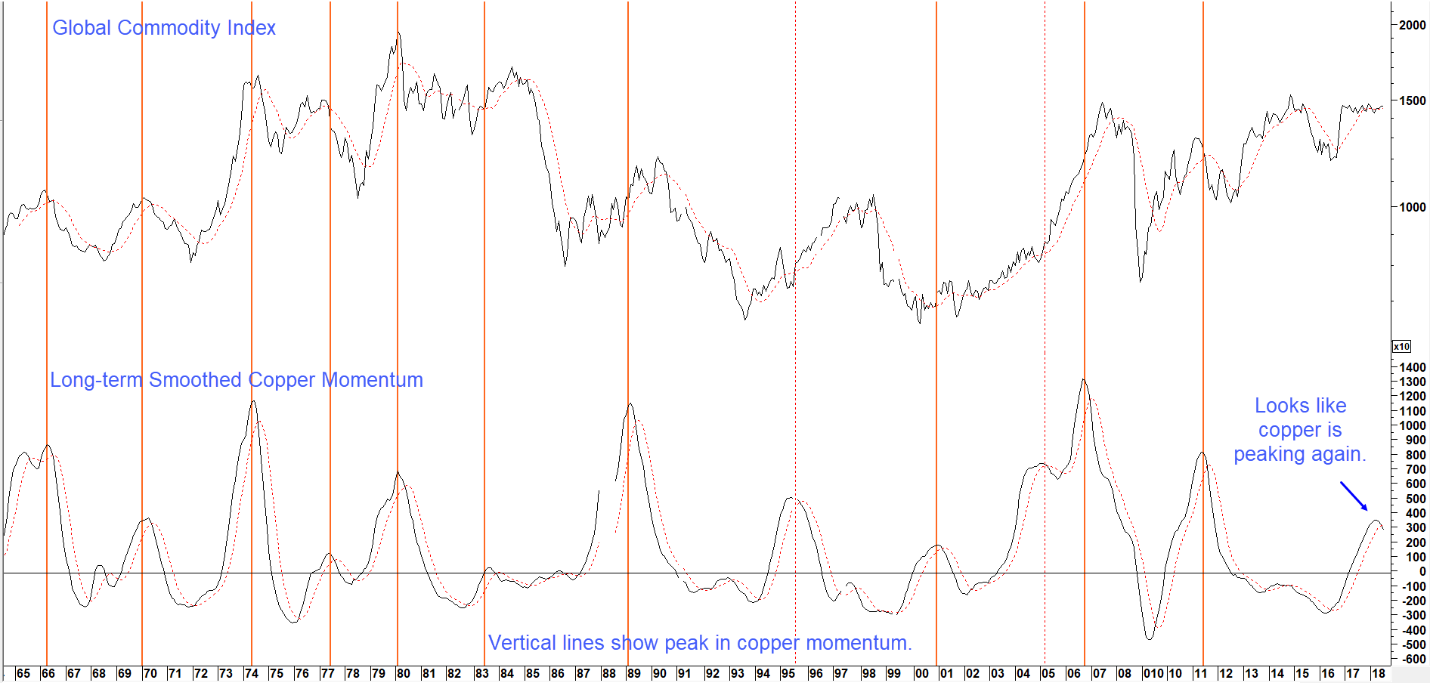
Chart 1 sets the scene, by comparing the Pring Global Commodity Index with a long-term smoothed momentum indicator of the copper price. For the record, the Index is calculated by combining euro, yen and dollar based industrial commodity prices (CRB Spot Raw Industrials) and weighting them by GDP. The vertical lines flag peaks in the copper momentum. With the notable exception of the 1995 and 2005 reversals, all such signals were followed by some form of decline in the commodity index. Some, such as 1966 resulted in an immediate turn, others, like the one triggered in 2006 for example, experienced a lag. The overall message from this relationship is pretty clear. A weakening in copper momentum is a reliable leading indication that commodity prices in general are about to drop. Where commodities go, the global economy usually follows.
Chart 1 Global Commodity Prices versus Copper Price Momentum 1965-2018
Sources: Reuters, Pring Research
When copper price momentum peaks that usually means industrial commodities in general will take a hit. (click chart to enlarge)
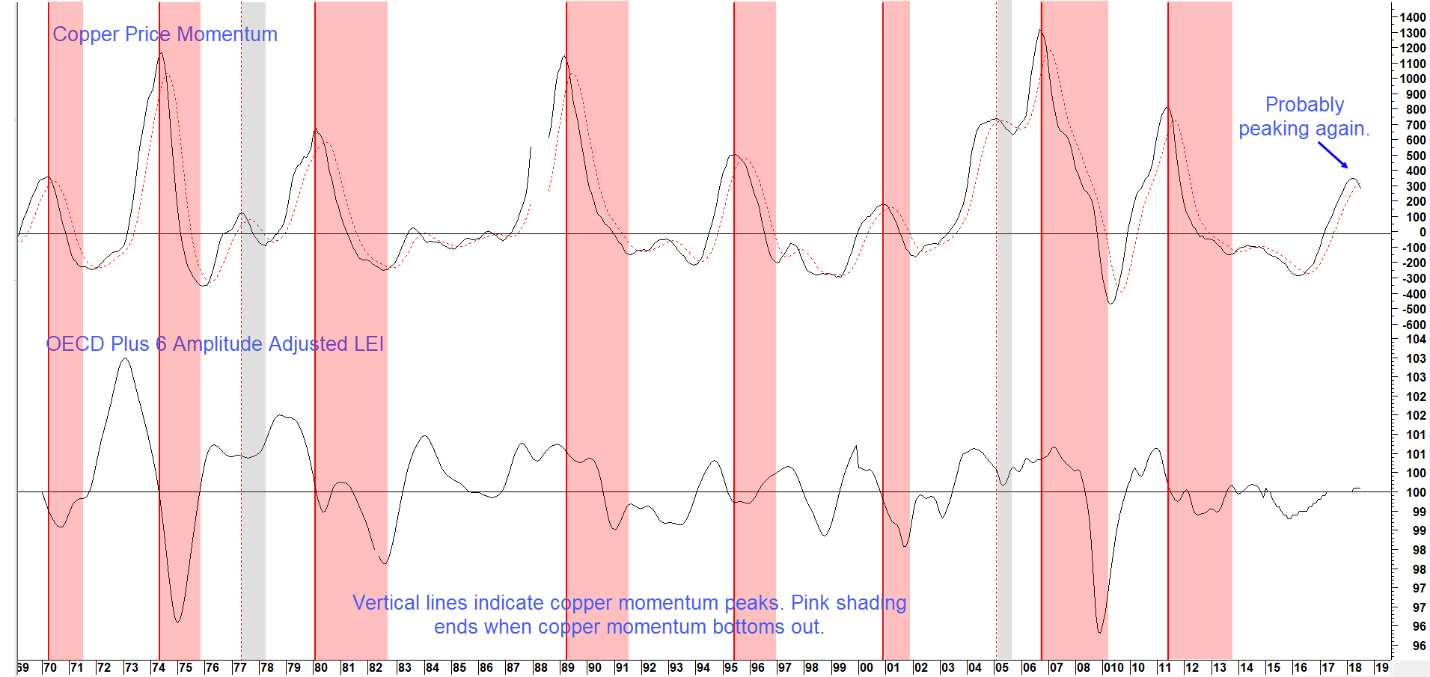
Taking it a step further, Chart 2 compares copper price momentum with the Organization for Economic Co-operation and Development (OECD) Plus 6 Amplitude Adjusted Leading Economic Indicator (LEI). The “Plus 6” refers to the inclusion of non-member OECD countries, such as China, so it’s really a proxy for the whole world. The shaded areas flag those periods when the copper momentum peaks from a position above zero and extends until it subsequently reverses to the upside. Note that in the vast majority of instances the OECD leading indicator was either declining or remained below its equilibrium level, as copper momentum was softening. The two gray shaded areas shown in 1977 and 2005 point out that this is not a perfect relationship. That’s because in those instances the economy failed to respond to weakening copper prices in its usual adverse way. The implication from the recent peaking action of copper price momentum therefore represents a strong warning that global economic conditions are probably less robust than most observers currently believe.
Chart 2 Copper Price Momentum versus the Global Economy 1969 -2018
Sources: Reuters, Organization for Economic Co-operation and Development, Pring Research
When copper momentum peaks the global economy usually suffers a significant slowdown or recession.(click chart to enlarge)
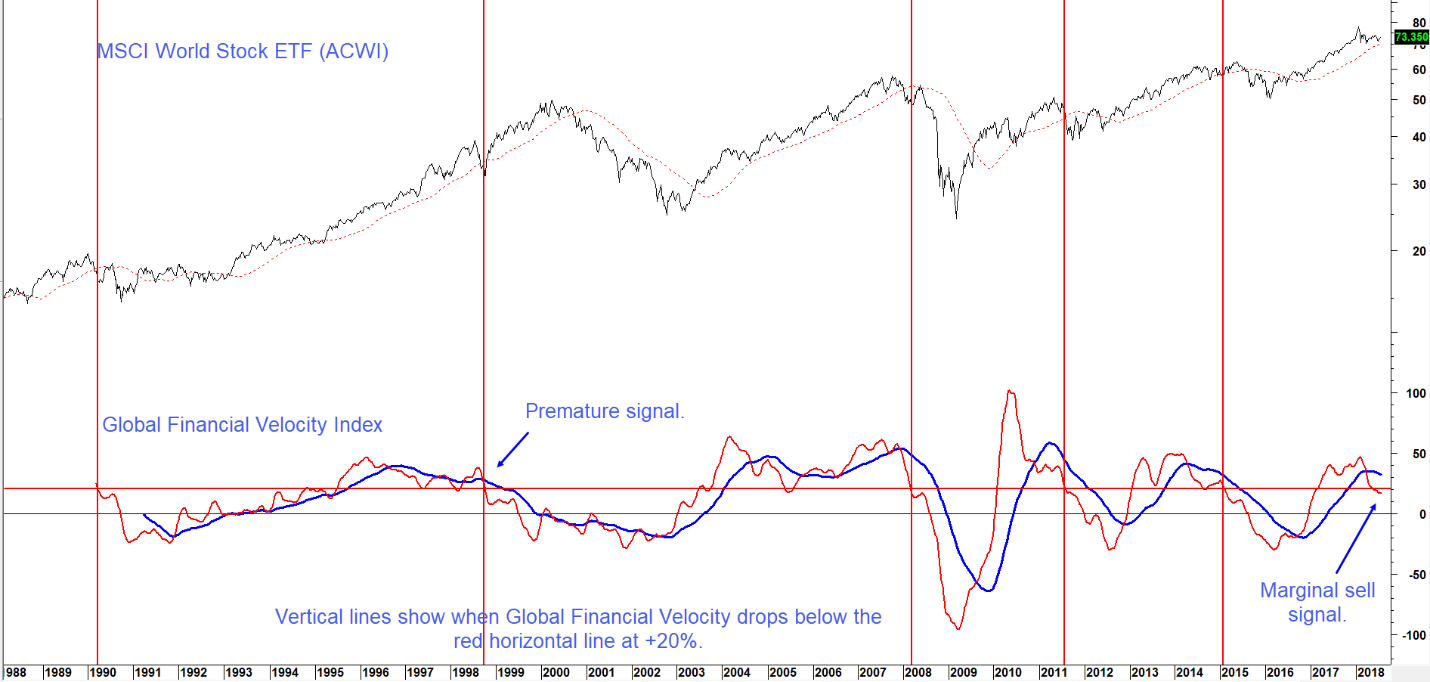
The prospect for a coming global slowdown is also borne out by our Global Financial Velocity Index (red) in the bottom panel of Chart 3, along with its 65 week moving average (blue), and the MSCI World Stock ETF (ACWI) in the top panel. This series is calculated by combining an unweighted rate-of-change for global bonds, stocks and commodities into one series. You can think of the Financial Velocity indicator as a proxy for the injection or draining of liquidity into the system. At the beginning of the cycle, the economy is in recession or slowdown mode. That’s when central banks inject liquidity into the system, causing interest rates to fall and bond prices, one of the ingredients of the Velocity Indicator, to rise. When the stock market senses improving economic conditions stemming from an easy money policy its momentum also bottoms. At that point, two components are rallying, thereby lifting the Financial Velocity Index itself. Eventually, the economy improves to the point where commodity momentum also bottoms. As business conditions heat up and commodity prices extend their advance, this puts upward pressure on interest rates, leading to a peak in bond price momentum. The Financial Velocity series is still able to move higher, because rising stock and commodity momentum outweigh peaking action in bonds. Eventually though, equity momentum starts to falter, as stock market participants sense that rising rates will adversely affect the economy and therefore corporate profits. At this latter part of the economic cycle when bonds and stocks lose upside momentum the Financial Velocity series peaks out.
The vertical lines show when the indicator crosses below the red horizontal line at just under 20%. That seems to be the critical level indicating that global equities are vulnerable. To prove the point, four of the five signals triggered in the last 30-years were associated with some kind of a bear or mini-bear market. (The 1998 signal turned out to be premature.) The indicator has now slipped to a position that is slightly below the line, so any additional weakness will confirm a decisive sixth sell signal for global stocks since 1990. Since Dr. Copper is forecasting weaker global commodity prices that will also add to the pressure on the velocity series.
Chart 3 Global Stocks versus The Global Financial Velocity Index
Sources: Reuters, Pring Research
Historically, when Global Financial Velocity drops below +20% it’s time for global stock investors to be careful. (click chart to enlarge)
Impact on the U.S. and Portfolio Risk Management
Two historically reliable indicators of global economic trend reversals, copper momentum and the Global Financial Velocity Index are pointing to slower worldwide economic growth. Whether that will transition into an actual global contraction is an open question, perhaps partly dependent on the resolution of the ongoing trade disputes. At this juncture a full blown recession seems unlikely, because the world’s largest economy (that just hit a Q2 4.1% GDP growth rate) appears to still have some life left in it.
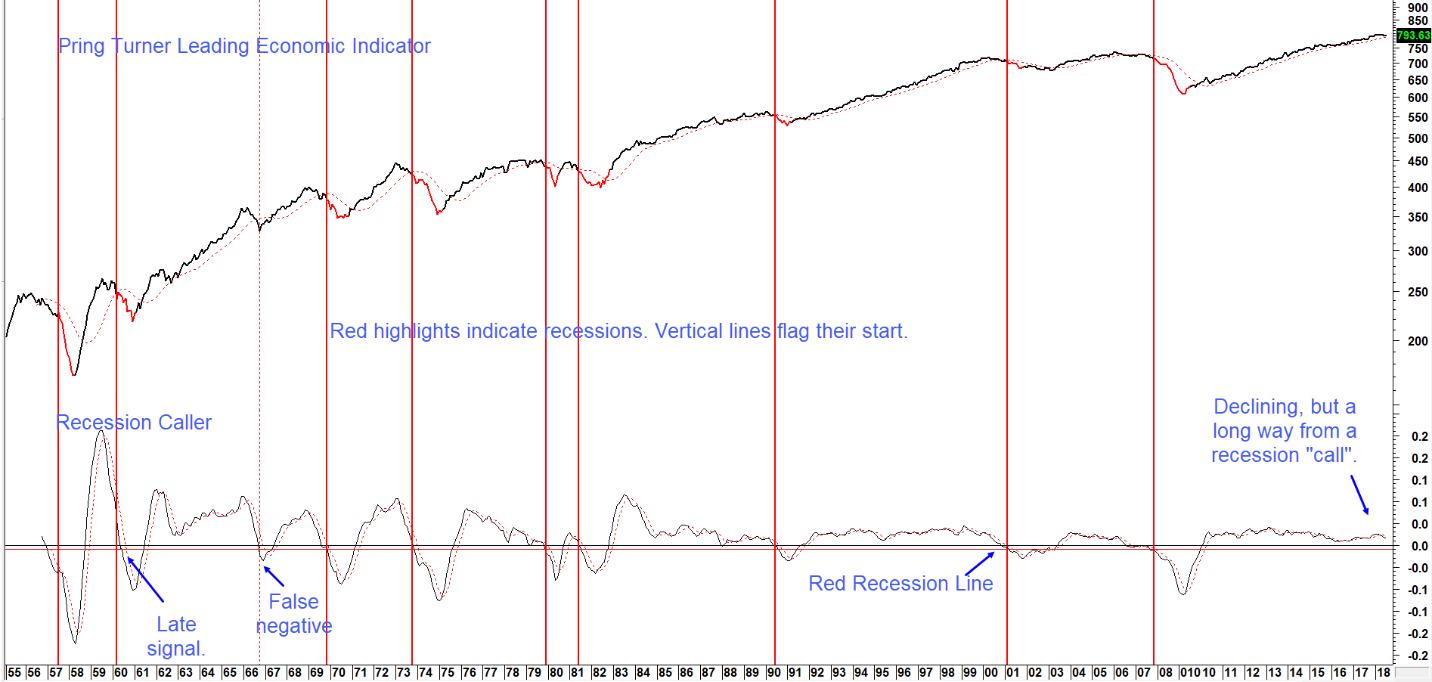
Case in point, Chart 4 features the Pring Turner U.S. Leading Economic Indicator and a growth derivative that we affectionately term the “recession caller”. The LEI itself is calculated from four key sectors, consumer spending, housing, the labor and stock markets. It has led every U.S. recession since the nineteen fifties, and signaled one growth slowdown in 1966 that did not quite turn into a recession. What is the message today? The growth derivative has started to decline, but is a long way from crossing the red recession line, thereby reducing the probability of a U.S. recession being triggered in the next couple of quarters or so.
Chart 4 Pring Turner U.S. Leading Economic Indicator and the Recession Caller
Sources: Reuters, Pring Research
The recession caller may have started its descent but has a long way to go before dropping below the red recession line. (click chart to enlarge)
Key Takeaways:
The last two occasions when the global economy suffered badly in 2011 and 2014, the U.S. slowed down but narrowly escaped a recession. The distinction between a slowdown and recession is important as U.S. equities experienced a mini-bear market under the slowdown environment but full-fledged 50%+ declines in the 2001 and 2008 recession-led bear markets.
As sub-advisors who utilize business cycle analysis to pro-actively adjust risk in portfolios, we believe it makes sense to begin planning defensive measures in portfolios. The big question for risk managers is whether or not the global economy can limit any downside activity to a modest slowdown and thereby sidestep a recession and full blown bear market for stocks.
A lot will depend on when copper momentum turns up again and we get that next bullish house call from Dr. Copper. The Pring Turner recession caller indicator is updated regularly, the best way to stay tuned to all updates is to join our free email list at the Pring Turner website.