
July 2018 will mark the 108th month of the economic recovery, making it the second longest expansion in history. Another 12-months or so and it will be the longest ever. Moreover, the consensus of economists foresees little trouble ahead. As of May 2018, Goldman Sachs US Economic team’s probability model assigned just a 5% likelihood of a recession during the next four quarters, with a 19% probability for the next two years. If they are right, those probabilities would place the current recovery well into record territory. That raises the question: Could it be that the four-year business cycle has finally been repealed?
No, The Business Cycle Has Not Been Repealed!
Why is this important? First, there is a rhythm to typical business activity that has repeated continuously since the beginning of the industrial revolution over 150 years ago. Second, the ideal asset allocation and sector rotation for investment portfolios can be adjusted based on the stage of the business cycle. This effort can increase investor returns while reducing risks. The business cycle investment process, similar to the continually changing seasons, follows a logical sequence to make active asset allocation decisions. As sub advisors with over 40 years making disciplined investment decisions for clients based on business cycle changes, we have to admit that the repeal of the business cycle would put us in a bad place! Fortunately for our methodology, there are two reasons why repeal is not likely to happen. First, economic decisions are often made for emotional reasons, which are strongly motivated by fear and greed at business cycle turning points. In fact, the investment management team at our Walnut Creek office often like to say: “The stock market is nothing more than fear and greed super-imposed upon the business cycle.” History is replete with examples of people and economic sectors overextending themselves and suffering the consequences. So, repealing the business cycle would therefore be tantamount to repealing human nature—not likely!
Growth Slowdowns vs. Recession
The other reason lies in the fact that the cycle has actually been operating normally since 2009. Instead of experiencing an actual contraction in business activity though, the US economy transitioned through two separate growth slowdowns. That’s exactly what happened in the 1960’s and 1990’s, both of which experienced a couple of mid-stream slowdowns.
The big benefit of a growth slowdown, is that it is a cathartic experience preventing the economy from overheating. It also allows it to re-group for further gains. This process is not unlike a pit stop in a car race. Such an environment is also associated with a mini-bear market in stocks, where prices drop between 10-20% or experience a multi-month trading range. That compares to a “real” bear, where a 30-50% drop is more likely when an actual business contraction is in the air. The result in the 1960’s,1990’s as well as the 2009-18 period, was a long-term uptrend separated by mini-bears. That tempered economic activity resulted in three secular bull markets.
Distinguishing Between a Slowdown and a Recession
Identifying a recession after the fact is a relatively easy task. That’s because it simply involves detecting a period in which economic activity goes negative. Isolating a growth slowdown is a more of a judgement call, because of the numerous statistical possibilities for monitoring the economy’s growth track. If the chosen time span is too short, false weakness may be signaled. If it’s too long, we are left with a lagging indicator. Slowdowns also seem to experience speedier reversals, which means that detecting them in real time is not easy. Often a “growth” recession is over before you know it has started.
Bearing that in mind, one solution that fits the narrative, reflects the economy and explains most associated movements in the stock market, is to use a momentum measure of the Chemical Activity Barometer, a composite leading economic indicator. The raw data is published by the American Chemistry Council, and has foreshadowed every recession since the early twentieth century. Its smoothed long-term momentum (KST) is featured in Charts 1 and 2 jointly covering the period since 1959. The red shadings indicate declining trends in the indicator that preceded a recession. They extend up to the recession’s ending, which sometimes develops simultaneously with the indicator itself, but usually precedes it. The gray shaded areas flag periods when the growth curve was in a declining mode, but where that weakness did not result in an actual contraction of business activity, merely a tempering of the growth rate. It is apparent that the 1960’s and 1990’s, just like the second decade of the current century, were all associated with such growth slowdowns. Note that at no time during these periods did the Barometer itself cross below its (red dashed) 24-month moving average (MA). Compare that to all the recessionary examples since 1955, which did.
Chart 1 The Chemical Activity Barometer and a Momentum Indicator 1959-1983
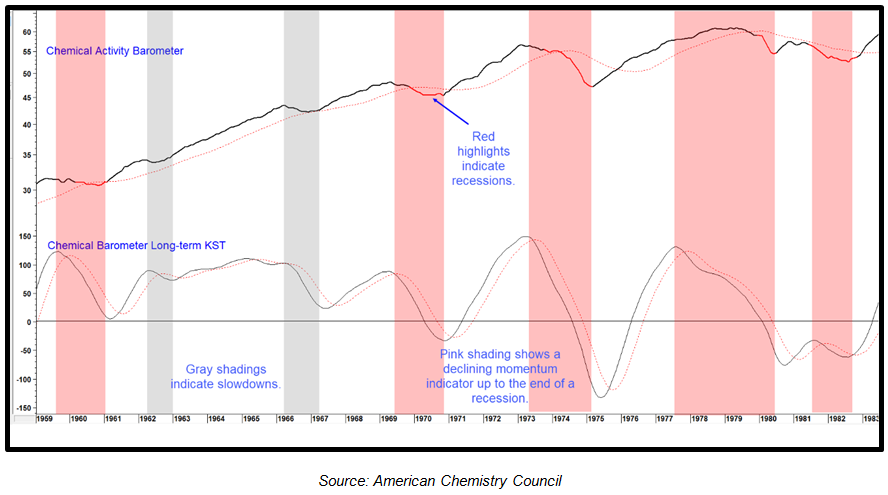
The 1961-69 recovery embraced two growth recessions. (click chart to enlarge)
Chart 2 The Chemical Activity Barometer and a Momentum Indicator 1983-2018
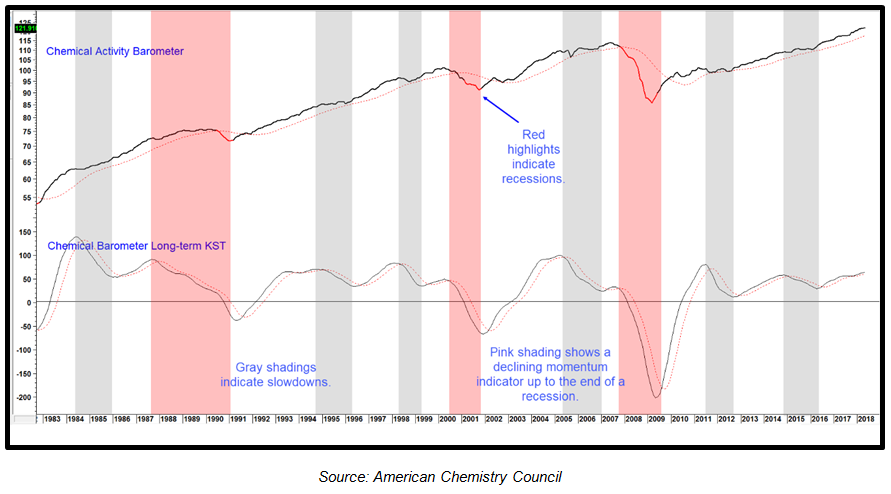
The 1991-2001 and 2009-20?? Recoveries embraced two growth recessions (click chart to enlarge)
Chart 2 demonstrates quite clearly that the cycle is still alive, but in a less volatile format. There are a number of reasons for this, but globalization, technological innovation, aging demographics and a growing debt burden come to the fore. In addition, memories of the severity of the financial crisis have remained vivid, and that has so far discouraged excessive risk taking in the private sector.
Where Are We Now and What Can We Expect?
The Chemical Barometer momentum reversed to the upside in 2016 and remains in an upward trajectory, though it has started to reach an extended level. Unfortunately, we do not have any great techniques for telling us how high it will go or when it will turn again. It could be a number of years, as was the case in 1963, when the indicator touched a similar level to where it is now. Alternatively, it could happen at any time, as it has already surpassed the previous 2014 peak. We can also observe, that four of the last recessions have been signaled when the oscillator was close or below the equilibrium level. Since it is moving away from such a signal its action is not inconsistent with the Goldman probability forecast cited earlier. Above all, it is fairly evident that the economic cyclic rhythms have not changed, a fact which indicates that the business cycle is alive and well.
What to Look For
In terms of duration this recovery is getting pretty long in the tooth. However, recoveries do not die of old age. They die because unwarranted confidence in a specific sector results in careless decisions thereby creating a state of imbalance in the overall economy. When the tide finally turns, usually helped by a trend of rising interest rates, these mistakes are revealed. As Warren Buffett’s famous quote states: “You only find out who is swimming naked when the tide goes out.”
The longer the recovery, the more time for distortions to build. For instance, in the last recession it was sub-prime loans, in 2001 the tech bubble, in 1990 it was the savings and loan crisis. By some measures, the economy has reached a mature phase as evidenced by three years of rising commodity prices, a yield curve close to inversion, a tightening labor market, etc.
Chart 3 offers a couple of indicators to monitor. The first is the US Treasury 10/1-yield curve, not chosen for its accuracy because all combinations have their weaknesses, rather for its longer historical perspective. The second is a momentum indicator constructed from the Pring Turner Leading Economic Indicator. This series is calculated from a weighted composite incorporating the financial sector, construction, consumer spending and a leading labor market indicator. It’s not as helpful in identifying slowdowns as the Chemical Barometer momentum in Charts 1 and 2. This derivative though, is known as the “recession caller” because of its relatively better timeliness in identifying the start of a recession. It does this as it approaches or actually crosses below its red horizontal “recession” line.
Chart 3 Treasury Yield Curve vs Pring Turner Recession Caller
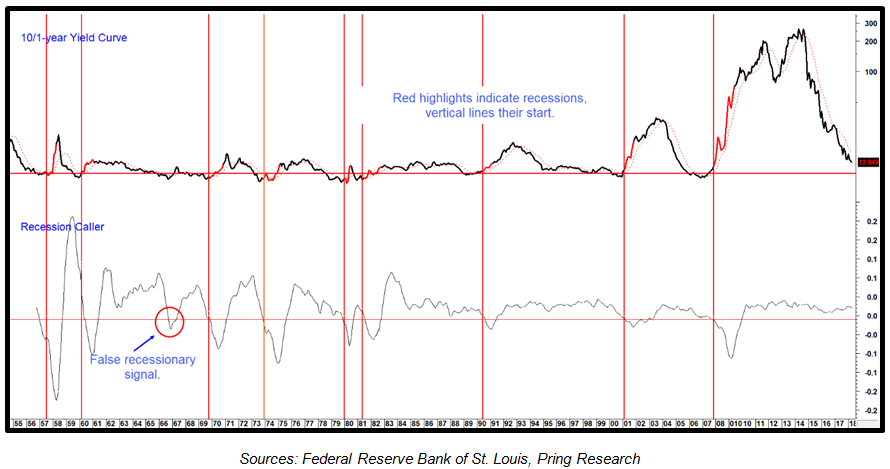
Both series are many months away from calling a recession. (Click Chart to Enlarge)
The red highlighted recessions in the top window tell us that every business cycle contraction since 1955 has been preceded by an inversion in the curve. When the curve is inverted it means that the 1-year yield is trading above its 10-year counterpart, a condition that indicates monetary conditions have tightened sufficiently to be consistent with a recession. However, this is a first step, as an economic contraction does not usually develop until financial conditions ameliorate. That is reflected in the chart by the curve crossing above its 12-month MA. All recessions since the late 1950’s were signaled in this way. The problem is that there are many examples of false negatives, which means that a 12-month MA crossover is not a sufficient condition in itself. That’s where the Recession Caller comes in, as it confirms when the real economy has actually started to respond negatively to the yield curve inversion by closing in on its recession line.
At present the yield curve is declining, but based on its current trajectory, looks to be many months away from an inversion, let alone an upside reversal. The recession caller, which is updated monthly and featured in research updates available at our web site www.pringturner.com is also comfortably above its warning level, so it’s steady as she goes until the evidence changes for the worse.
This recovery could well be headed for a record in terms of length, but don’t get too comfortable, because it is unlikely that the business cycle has been repealed. This means when this potentially record tide recedes it’s likely to expose a larger than normal crowd of naked swimmers. Rather than being victimized by inevitable cyclical declines, investors should anticipate and be prepared for the ever-changing financial market seasons. In fact, understanding the progress of the business cycle is a powerful and effective portfolio risk management strategy.