
In the fall of 1981, the twenty-year US bond yield peaked slightly above 15% and has been zig zagging down through each successive business cycle since. During the last one hundred and sixty-years or so, the average secular, (very long-term) trend in rates has lasted around twenty seven-years. After thirty five-years of declining rates, the current secular bear is getting long in the tooth. Thus far our late 2016 forecast A Turn in the Tide: The Case for Rising Interest Rates, appears prescient as the low watermark for yields remains in place. The question naturally arises, as to what technical signals you should follow to reliably confirm the reversal.
Previous secular trend reversals
At the outset, it’s important to bear in mind that there have only been four previous secular trend reversals. This greatly limits the data points on which to base our analysis. The length of such trends also means that indications of a reversal are usually given several years after the final turning point. Nevertheless, it is possible to list four technical characteristics that have been present at previous turning points.
They are, price patterns, moving average crossovers, trendline violations and momentum characteristics. Let’s apply them all to recent action for the twenty-year yield and see where we come out.
Technical evidence required for a secular reversal
Price Patterns
Chart 1, which features the trend of government bond yields back to the 1870’s, shows that there have been five secular trends since then. Three were down and two up. The average duration of two bulls was thirty-years and that for the two completed bears, twenty-five. Based on duration alone, that makes the most recent thirty five-year drop since 1981, ripe for a turn.
Using the benefit of hindsight, it is quite easy to identify previous peaks and troughs, but in real time we do not have that luxury. The trend of rates though, rarely reverses on a dime, instead slowing its upward or downward trajectory ahead of time as it adjusts to structural and institutional changes in the economy. Oil tankers take a long time to turn around, so do secular trends in financial markets. These transition periods take the form of multi-year trading ranges, the average duration of which has approximated twelve-years. Depending on whether 2011 or 2014 is taken as the reference point for the beginning of the current trading range (see the small horizontal lines), that would translate to a breakout in the next six-nine- years. Alternatively, we could consider the six-year average time between the secular turning point and the subsequent breakout. That would translate to a 2022 signal based on the 2016 low. Normally, secular reversals develop more or less simultaneously for the vast majority of maturities, though the data on which this conclusion is based is pretty scant. In the current situation though, many shorter-term maturities of five-years or less, bottomed in the 2011-12 period. That suggests that the base building process for the current cycle may be far more advanced than an analysis of the twenty-year series alone would have us believe. Bottom line, we should expect to see a breakout at any time.
Chart 1 Government 20-Year Yield 1876—2017 (click to enlarge)
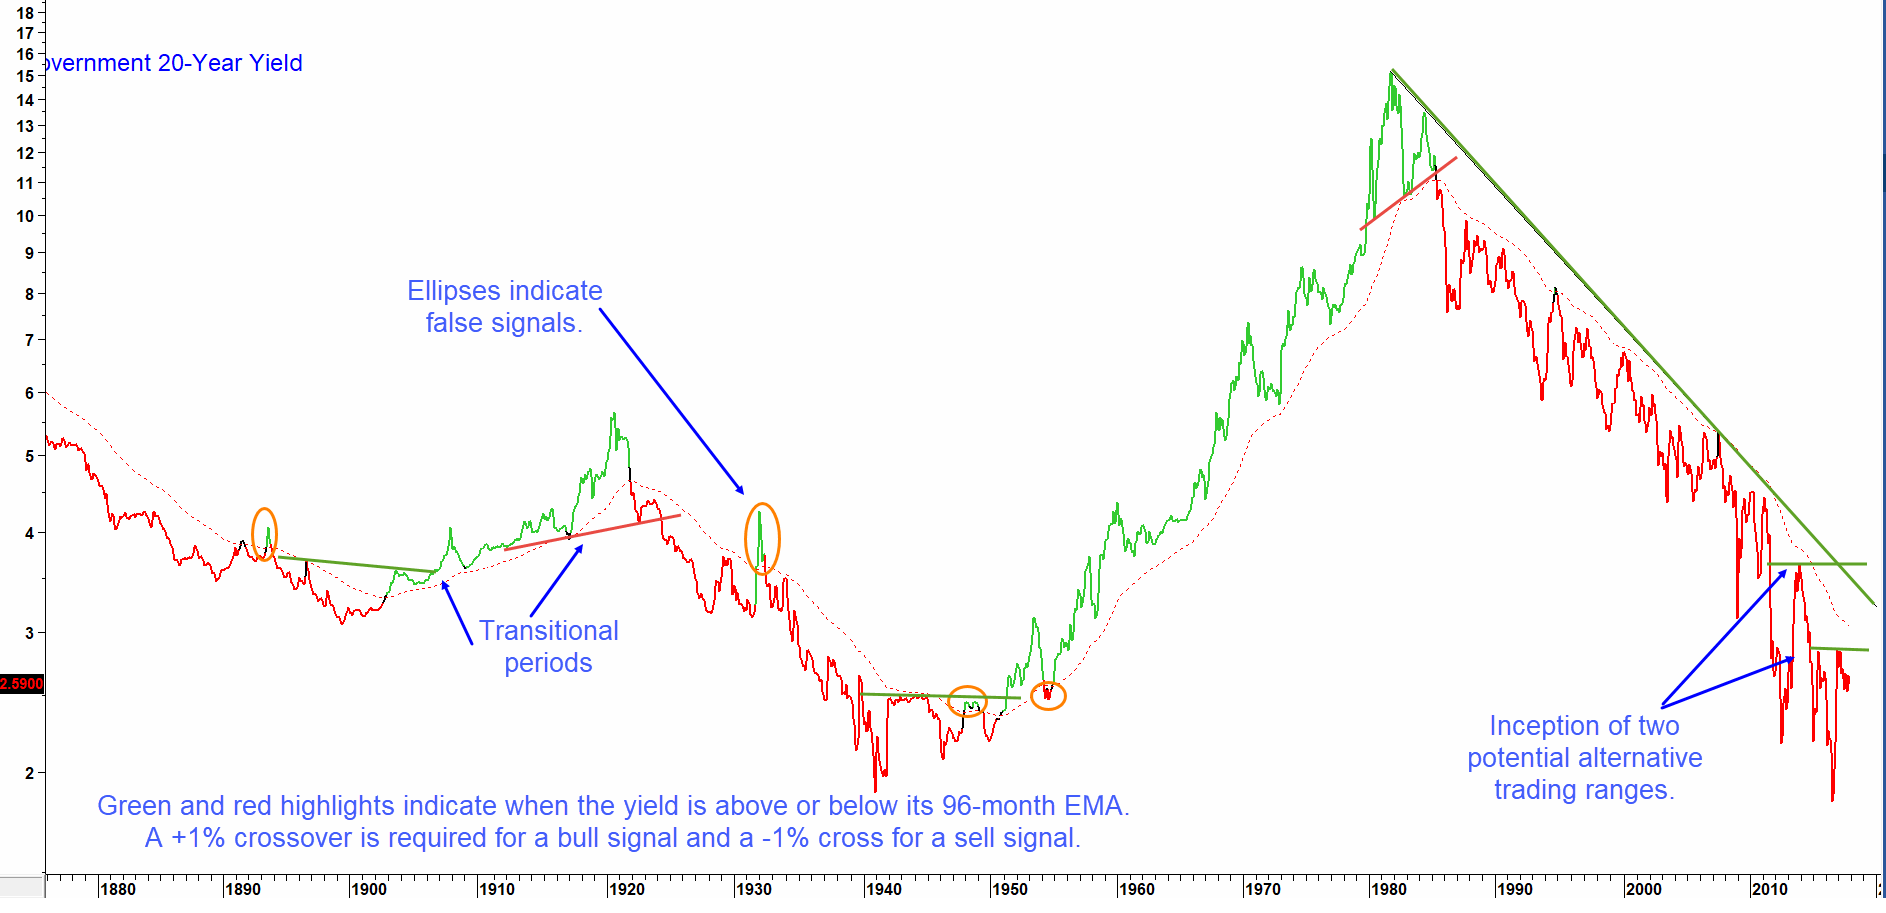
Source: Reuters & Martin Pring’s Intermarket Review
Crossovers of the 96-month Exponential Moving Average (EMA) have offered reliable signals of secular reversals.
Moving Average Crossovers
Applying moving averages to a set of financial market data is always a trade-off between timeliness and sensitivity. A short time span will return timely signals, but many will be false. On the other hand, a substantially longer one, runs the risk of crossovers being unduly late and failing to capture the bulk of a price move. One approach, that works well in navigating volatile cyclical bond yield swings, compares the monthly observation to a ninety six-month EMA. The green highlights in Chart 1 show when the yield is positioned 1% or more above the average and red, when more than 1% below. The four ellipses contain the only false signals that have developed since the 1890’s. The last one was generated over sixty-years ago, in 1954. For the twenty-year yield, the ninety six-month EMA is currently at 3.04%. Incidentally, the average time taken to cross the EMA from the previous secular extremity was fifty three-months. This compares to seventeen-months that have elapsed since the 2016 low.
Trendline Violations
Occasionally it has been possible to construct long-term trendlines for the yield, the violation of which, has signaled a major reversal. These have been highlighted in Chart 2. Trendlines obtain significance from their length, the longer the line the bigger the trend being monitored, and the number of times touched or approached. That’s because a good line is nothing more or less than a dynamic level of support or resistance. Consequently, the more times it has turned back rallies or reactions, the better. A third factor is the angle of ascent or descent. The sharper it is, the less sustainable the trend and therefore the less important. On all three counts, the line emanating in 1981 is formidable. It currently stands about 60 basis points above the December monthly average closing yield at 2.59%.
Chart 2 Government 20-Year Yield and a 240-month ROC (click to enlarge)
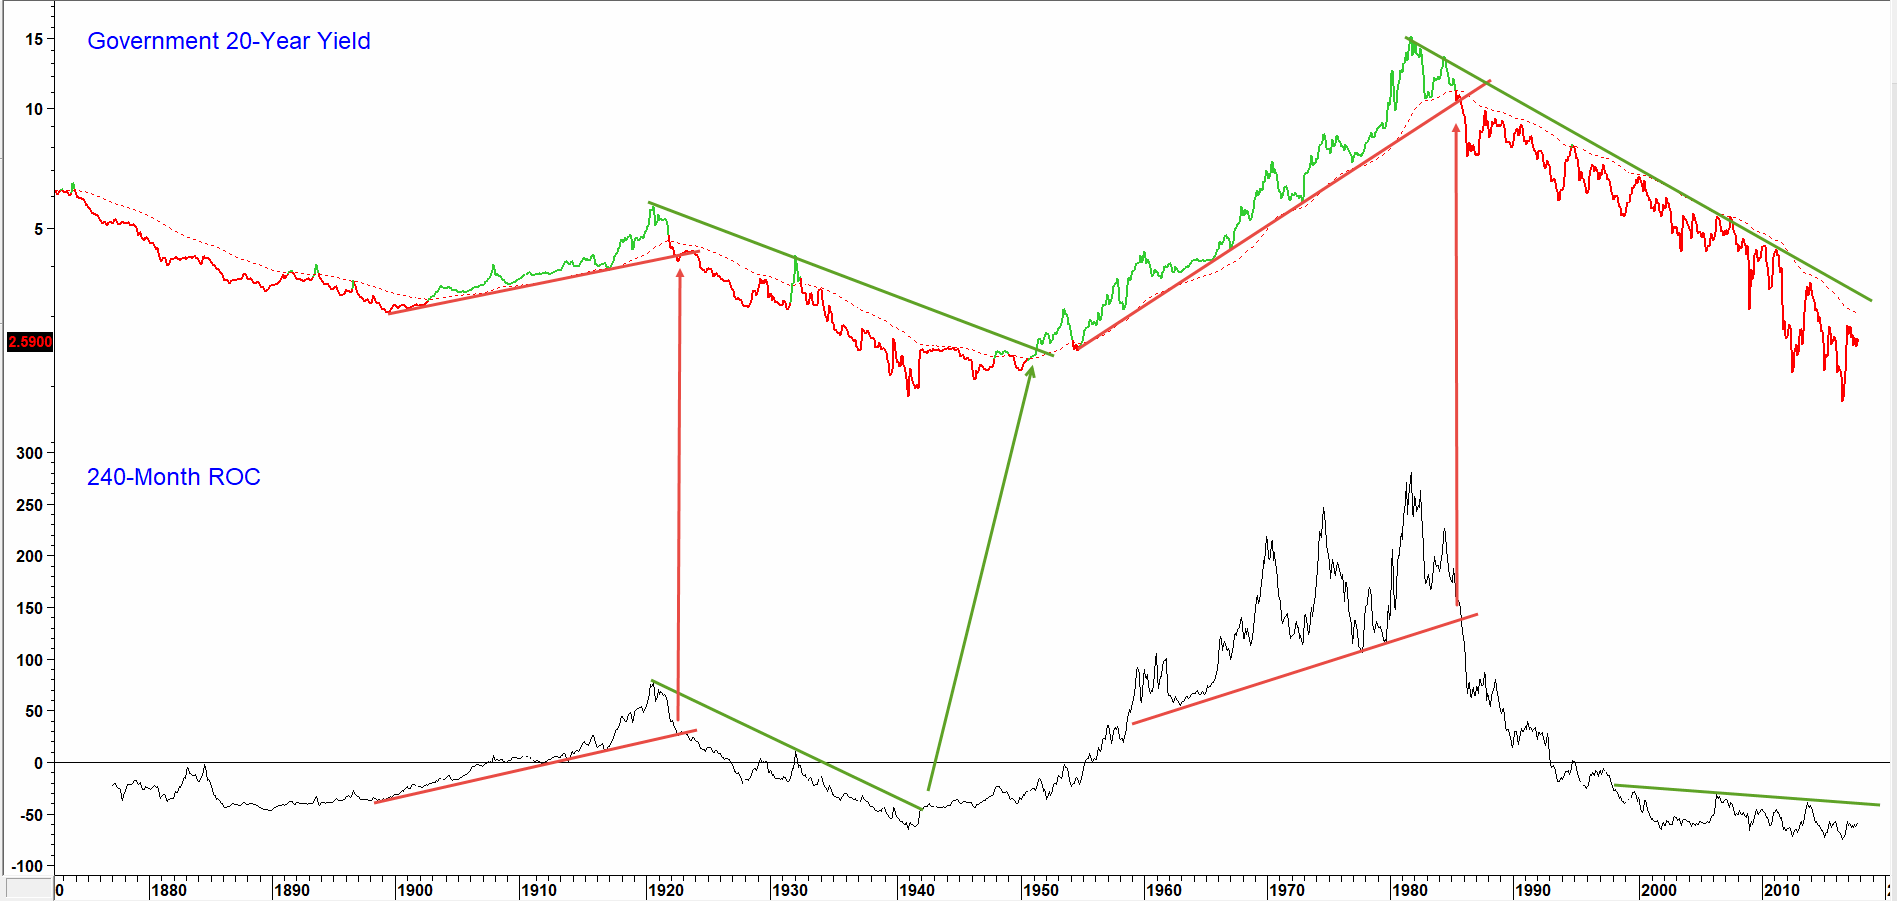
Source: Reuters & Martin Pring’s Intermarket Review
Joint trendline violations of price and momentum trigger reliable secular reversal signals.
The potential for a major breakout is not limited to the US. Chart 3 shows that ten-year yields for the UK, Germany and Japan are all very close to a major upside trendline break. The US appears to be leading the way with a tentative January breakout. This is closely followed by Japan. Under the principle of commonality, the more markets that are enjoying the same technical characteristics the stronger the signal. In short, when a secular reversals is signaled it is likely to be a global event.
Chart 3 International Government Yields) (click to enlarge)
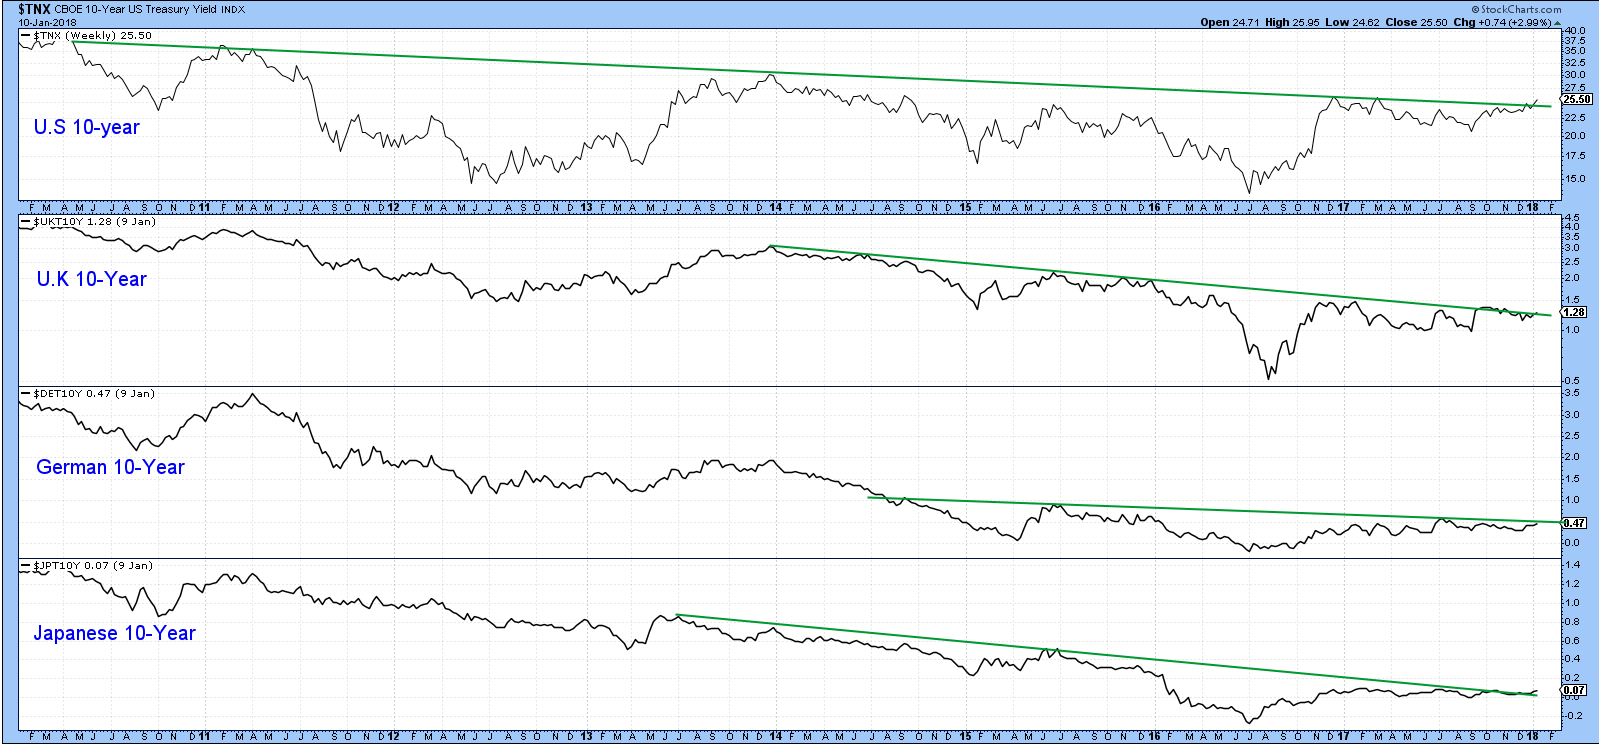
Source: StockCharts.com & Martin Pring’s Intermarket Review
All four yields are close to a multi-year breakout. The more breakouts the stronger the signal.
Momentum Characteristics
Momentum can also play its part. In this respect, Chart 2 also shows that it is also possible to construct trendlines against a two hundred and forty-month ROC. When violated, and this is confirmed by a similar break in price, a secular reversal signal is triggered. Since the late nineteen century only three such completed setups have materialized. Now a fourth appears to be in the making, as the top of a nineteen year trading range is being flagged by a resistance trendline.
Finally, Chart 4 displays a price oscillator, where a sixty-month simple moving average is divided by a three hundred and sixty month time span. These parameters monitor very long-term cycles and are useful in identifying secular reversals in commodities and stocks. When this series crosses above or below its forty-eight month moving average, relatively timely signals are given. Bearish periods have been flagged with pink shading. This approach, as we might expect, shows a similar dissipation of downside momentum as a possible prelude to an eventual reversal.
Chart 4 Government 20-Year Yield and a Secular Price Oscillator (click to enlarge)
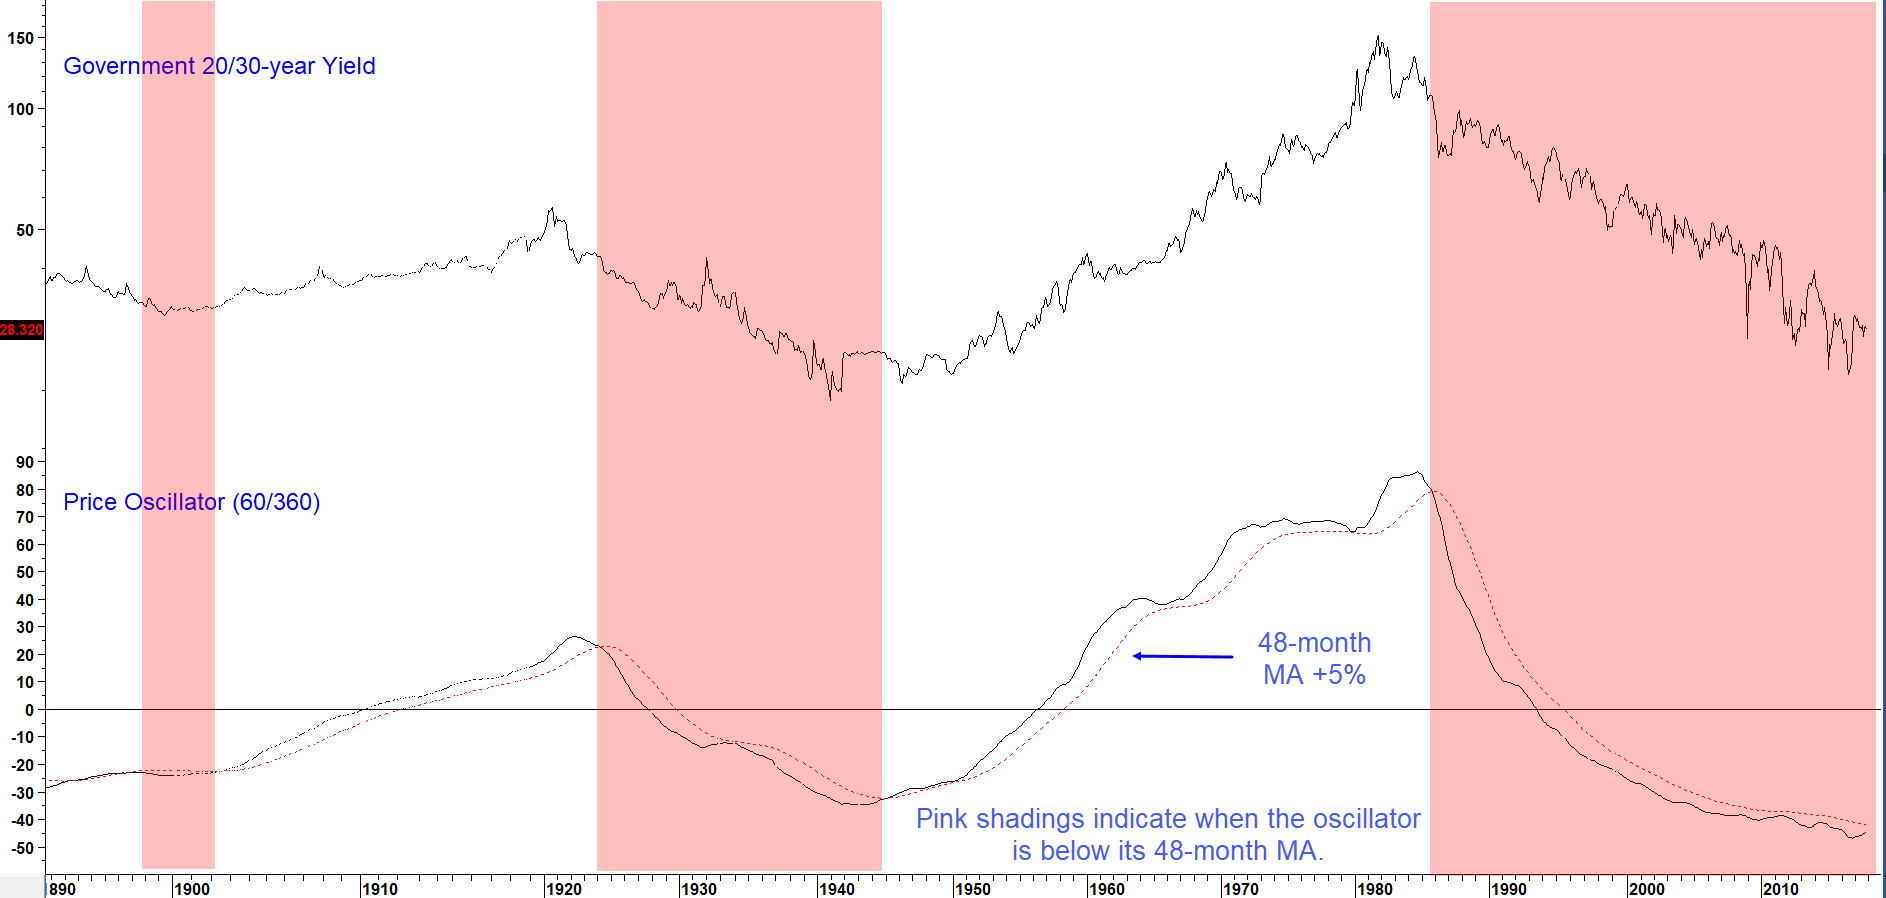
Source: Reuters & Martin Pring’s Intermarket Review
Oscillator 48-month MA crossovers offer reliable secular trend reversal signals,
The Secular Trend Has Already Reversed for 5-year Maturities
Not all maturities are created equal. For instance, the five-year series, bottomed in 2012, and is now leading yields further down the curve higher. Its base building process is therefore more advanced than that for longer-term maturities. For instance, Chart 5 shows that it completed and broke out from a seven-year base in 2016. Following a consolidation of those gains, it has now moved on to register a new recovery high. In October of last year further evidence of a secular turn came when its nine-month EMA crossed above its ninety- six-month counterpart. That’s a slightly higher bar than we used for the twenty-year yield. The two hundred and forty-month ROC is right at its twenty- three-year resistance trendline, but the price oscillator has crossed decisively above its forty-eight-month MA. We can also observe a definite progression of primary trend rising peaks and troughs in the yield itself. It’s true that the secular down trendline dating from 1981 has not yet been penetrated, but by and large the weight of the evidence certainly indicates a secular bull market.
Chart 5 Five Year Government Yield and Two Momentum Indicators (click to enlarge)
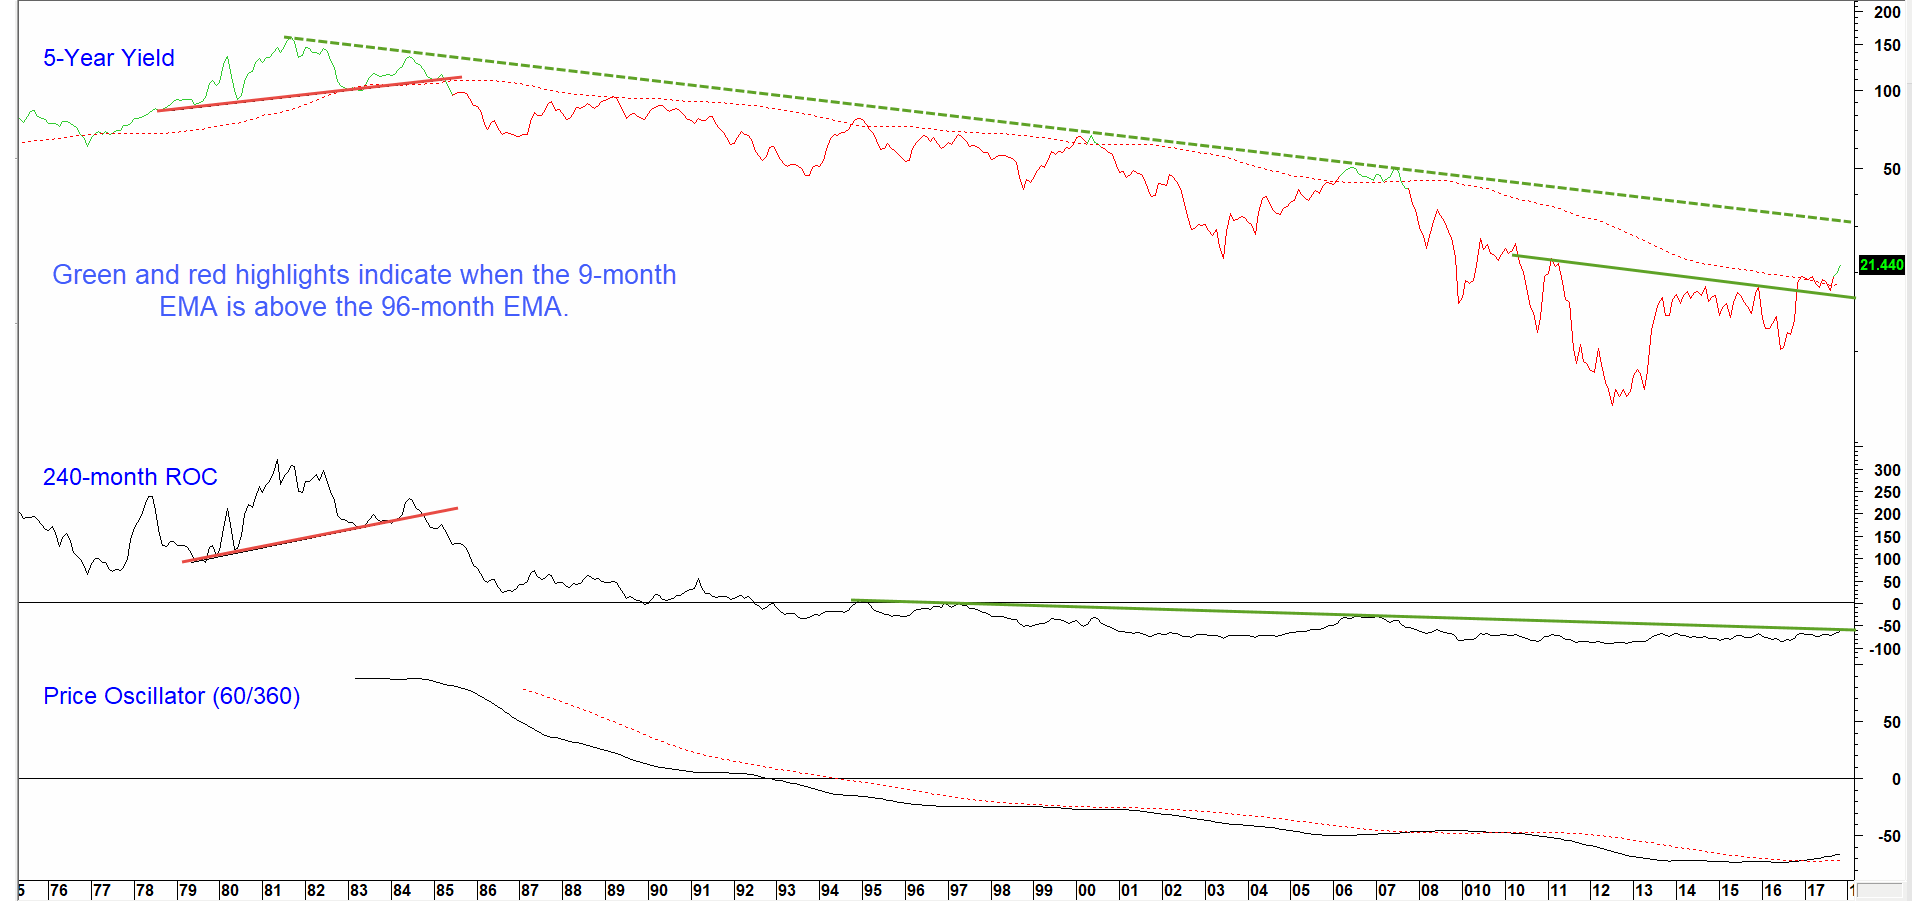
Source: Reuters & Martin Pring’s Intermarket Review
This maturity has completed a base, crossed its EMA and experienced a positive price oscillator reversal.
Investment implications going forwards
Twenty-year government bond yields bottomed in 2016 and have not yet signaled a secular reversal. Shorter-term maturities, such as the five-year yield, touched their low water mark four years earlier in 2012 and have signaled a secular reversal. The direction of the secular trend of rates therefore, is not so much in the eye of the beholder as in the length of the maturity under consideration.
Regarding the twenty-year yield, some initial signs, in the form of a dissipation of downside momentum and base building are apparent. However, until we see some of the trend reversal signals cited above, it is wiser to assume that the ranging action of the last few years is still in force.
Our quest as conservative investment advisors is to detect significant changes in financial asset trends as early as possible. We believe early detection of cyclical and secular turning points and aligning portfolios with those new trends makes our mission to protect and grow clients’ valuable assets easier and with less risk. Obviously, a secular bull market in longer dated maturities, when signaled, will present a challenge to bond investors. That’s because history shows that bull markets for prices are shorter and have less magnitude during secular bull markets for yields. Conversely cyclical bear markets for prices will be greater in duration and magnitude. Given the recent changes in the long term trend of interest rates we are focusing our fixed income investments on a tactical business cycle basis and continuing to implement bond ladder techniques to better protect clients from rising rates.