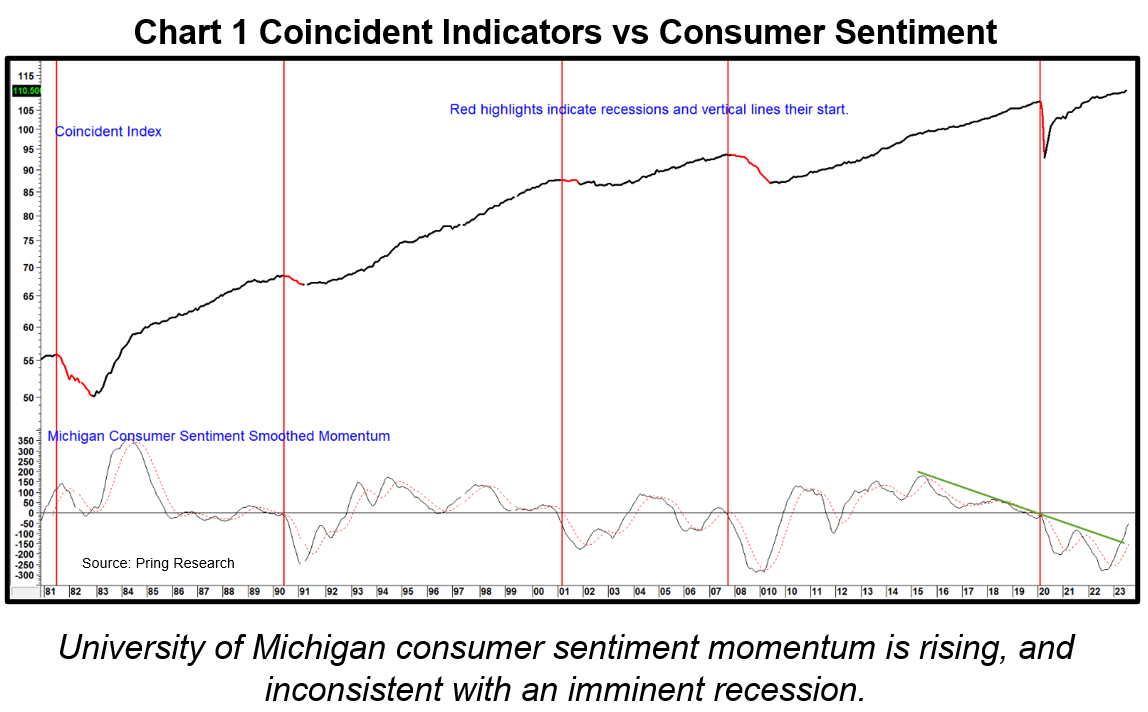
In February this year we wrote an article entitled A Funny Thing Happened on the Way to the Recession. It observed that the consensus of commentators was calling for a recession but concluded that such an outcome was unlikely. Our rationale was based on two things. First from a contrarian aspect, when widespread views of an impending economic decline take hold it’s not unreasonable to expect people will take steps to protect themselves ahead of time. After all, who wants to remain on the railroad tracks when it is obvious a train is coming? A second, and a more practical reason for our optimistic outlook was that some historically reliable forward-looking economic indicators had begun to improve.
Fast forward to the current situation, where opinion has shifted away from recession in favor of a soft-landing scenario. Does that same contrary analysis mean a recession is now more likely? The simple answer is no, not yet anyway! First, the current soft-landing views are not as widespread and solidified as were recessionary expectations earlier this year. We can see that from Chart 1, which compares University of Michigan consumer sentiment to the Conference Board’s Coincident Indicators. If expectations had grown too optimistic this would show up in the data. However, the long-term smoothed momentum for sentiment is currently at a subdued reading. Indeed, it has just violated a key down trendline. Such action indicates a firming of upside momentum, which suggests a further improvement in confidence and the economy lies directly ahead.

Chart 2 demonstrates the close connection between the stock market and movements in the economy. The vertical lines mark those periods when a derivative of the OECD Leading Economic Indicator (LEI) for the US reverses to the upside. Such action typically coincides with, and occasionally leads the end of recessions, which have been highlighted in red. As long as this indicator is rising, it remains a positive factor for equities and the economy.

Our Pring Turner LEI, and its derivative, named the “Recession Caller” are also in a constructive mode. The latter “calls” recessions when it drops decisively below the red recession line. Earlier this year the Caller dropped to it but failed to achieve a decisive penetration. The indicator has subsequently bounced to the zero level. Previous instances of decisive equilibrium crossovers have been highlighted by the vertical lines. All were followed by a lengthy recovery in the LEI itself. Preliminary August data shows that the Caller is edging higher, but the zero penetration is not yet decisive.

The possibility of the indicator tricking us once again by slipping back into negative territory, as it did prior to the 1980 and 2008 recessions, as shown in the two ellipses, is unlikely. To understand why, please refer to Charts 4,5 and 6, as they demonstrate the differences between now and then. Chart 4 features a price oscillator for three leading economic indicators for the period just prior to the vertical red line marking the start of the 1980 recession. They are momentum measures for ISM new manufacturing orders, new home sales and the OECD leading economic indicator for the US. At that time, all three were in a declining mode.

Chart 5 focuses on those same indicators just prior to the Great Financial Crisis, when it looked as if the Pring Turner Recession Caller had successfully bounced off the recession line. This chart also reveals a similar pattern of pre-recession weakness.

Finally, Chart 6 brings us up to date, where it is clear that all three indicators are currently positioned in an upward trajectory. Rising short-term rates may cause a change going forward but, with the evidence currently available, none of these indicators are consistent with an imminent recession, which makes an economic soft landing scenario quite viable.

One caveat from Chart 6 is that none of those indicators offered a recession warning in 2020 because it was a black swan event, artificially brought on by government action. Unfortunately, our Black Swan Indicator is still under development along with its companion the Holy Grail!
The Labor Market Has Begun to Deteriorate
Chart 7 makes note of the fact that leading indicators of the labor market are currently softening. For example, the ratio between part-time and full-time workers is a leading indicator because hiring or firing part time workers is a lot easier than full time individuals due to less significant economic and legal constraints. The chart demonstrates that momentum calculated from the ratio recently crossed below zero, a level that has often warned of an impending recession. The good news is that a derivative of the OECD published leading US economic indicator has a strong tendency to bottom out ahead of this labor market relationship. The chart shows that this process is already underway and that an improvement in the labor market should soon take hold.

There is Always Another Recession
History tells us that, unless the business cycle along with human nature has been repealed, another recession inevitably lies down the road. It’s just a question of when and how deep. Many yield curve spreads inverted late last year, an event which has consistently foreshadowed business contractions since the 1950’s. Unfortunately, the leads have varied from a few months to almost two years. That leaves plenty of room for interpretation and certainly time for the latest inversion to eventually validate itself.
One possible scenario would be for the economy to experience a decent bounce, only to fulfill the negative yield curve omen at a much later date. In our opinion, that is likely to happen when the majority has begun to look up at the very time the leading indicators themselves have begun to turn down!

