
Even though we have already experienced the longest expansion on record, the latest data suggest the possibility of a resurging level of business activity as the economy emerges from its third post 2009 slowdown. As a follow-up to our July article, Recovery or Recession? Ask the Stock Market Stupid!, here’s our latest business cycle update.
Contrary Opinion and the Pring Turner Approach
It’s well-known in investment circles, that when a recession begins, most economists are still offering rosy forecasts. That does not appear to be the case at present. Instead, what we have recently experienced, is rampant talk of recession with concerns ranging from inverted yield curves, weak ISM numbers, slower job growth and so forth. From a contrarian aspect that wide level of concern is actually constructive! The late contrarian Humphrey Neil once reminded us that crowds, tend to extrapolate recent trends because they feel more comfortable with the status quo than going out on a limb and taking a forecasting risk.
At Pring Turner we take advantage of the reality that the business cycle is nothing more or less than a repetitive sequence of chronological events. Consequently, it is continually transitioning through a progression of seasons, each of which demonstrably favors specific asset classes and stock market sectors. This approach, which we have used as the foundation of our investment management practice and are continuously honing, puts us in a better position to identify the current phase or investment season and allocate assets accordingly. Why load up on stocks just prior to a recession and why own a slug of bonds in the inflationary season?
An Examination of Some Reliable Forward-Looking Indicators
So where is the economy likely to take us now? If we want some guidance as to which fork in the track a train will take, it’s no good looking at the caboose, as that’s a lagging indicator. Rather, it’s the engine that should command our attention, because it’s a leading one. By the same token, if we want to figure out where the economy is headed, coincident indicators, such as nonfarm payrolls or GDP, should be downplayed in favor to those that turn ahead of the economy.
Specifically, we are going to consider four reliable indicators that have consistently led the economy into and out of recession over the last six decades or so. They are, the Chemical Activity Barometer (CAB), housing starts, the Pring Turner Leading Economic Indicator and, what we call, the Equity Kicker. Let’s start off with the CAB, as this series can best explain business cycle activity during the post-2009 recovery. It is a composite leading economic indicator published by the American Chemistry Council and has foreshadowed every recession since the early twentieth century. The lead times range between 2 and 14 months, with an average of 8 months. Its reliance of data from the chemical supply chain makes it unique, which means that it can act as a check on other LEI’s. The red highlights in Chart 1 represent recessions, whereas beige reflects our classification of growth slowdowns. Fluctuations in the price oscillator, in the bottom window, show us that there have been three slowdowns and two recoveries since the financial crisis of 2008-9.
All recessions are preceded by slowdowns that don’t remain that way, because they subsequently morph into business contractions. A reliable technique for discriminating between the two, is to see whether the CAB can avoid a negative 24-month moving average (MA) crossover, shown as a price oscillator in the lower panel. That’s an important point because crossovers have preceded every recession since the mid-1950’s. By the same token, no slowdown since the 1950’s, with the exception of the miniscule one-month negative reading of -.26 in 2012, has experienced a negative 24-month MA crossover.
Currently, the oscillator is challenging its 2012 low, so it’s not yet possible to conclude that it is definitively signaling an end to the growth slowdown, merely that it looks likely. For a stronger indication that the economy might soon be about to emerge from the growth slowdown we need to turn to the housing sector.
Chart 1 The Chemical Activity Barometer and a Momentum Indicator 1990-2019
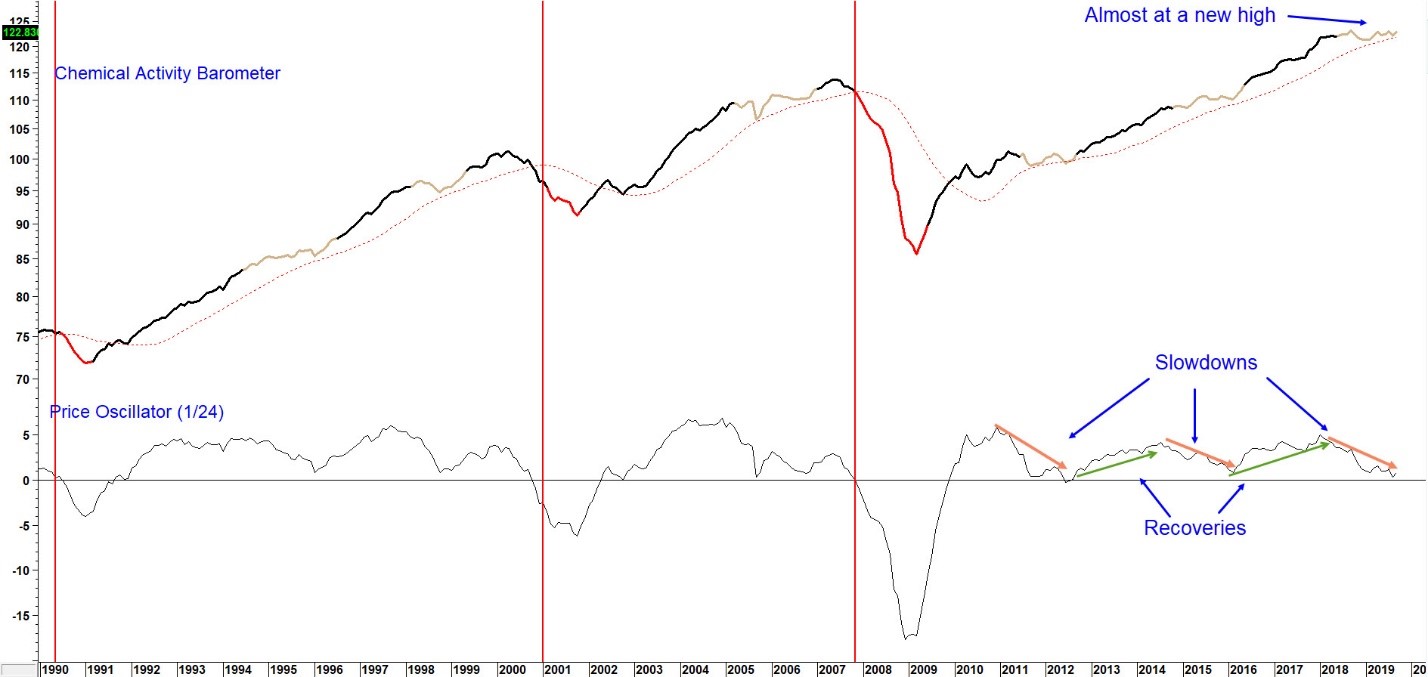
Sources: American Chemistry Council, Pring Research
There have been two recoveries and three slowdowns without a recession since 2009 (click chart to enlarge)
Housing Starts
Housing start numbers have the strongest leading tendencies of any other individual economic sector due to their interest sensitive characteristics. The recessionary lead times for the 4-month moving average (MA) vary from 5-months in 1981 to slightly over 4–years in 1990. The average in all cycles in the last 60-years or so has been around 20–months. Based on the large variation in lead times, starts are not very useful for identifying the precise timing of a recession. It’s also true, that housing is not a large part of the economy. According to Google it formed just 6% of 2018’s GDP. It’s actually a bit more than that when you take in the secondary effects from the need to furnish new houses with things like window coverings, appliances and so forth. For analysts though, upside reversals in housing offer the first non-financial signal that the economy is on the mend.
The 4-month MA of housing starts in Chart 2, is currently challenging its May 2018 recovery high. That tells us two things. First, starts are not forecasting a recession. More importantly, since they are poised to move to a new recovery high, we are likely to get a signal that the economy is emerging from the slowdown. That’s also the message from the smoothed momentum calculated from the new home sales/inventory ratio, plotted in the lower window of Chart 2. The arrows signal when it crosses above the green dashed horizontal line. Such action represents an initial unwinding of new home inventory and is typically followed by an expansion in starts themselves. These rallies have lasted as little as six months but usually far longer. The latest signal was generated in June, leaving lots of time to enable that 4-month average to reach a significant post recovery high.
Chart 2 Housing Starts versus the New Home Sales/Inventory Ratio 1965-2019

Source: Pring Research, Reuters
This long leading indicator is about to move to a new recovery high, signally another extension to this economic cycle. (click chart to enlarge)
Chart 3 features the smoothed long-term momentum of four other indicators tied to the housing industry. They have been arranged in an approximate chronological sequence as they develop during the course of the business cycle. The vertical lines join the MA crossovers in the new homes supply momentum to a similar crossover for housing starts. This shows that the recent upside momentum reversal for housing starts is not taking place in isolation, but as part of the usual business cycle sequence.
Chart 3 Four Housing Industry Indicators 1966-2019
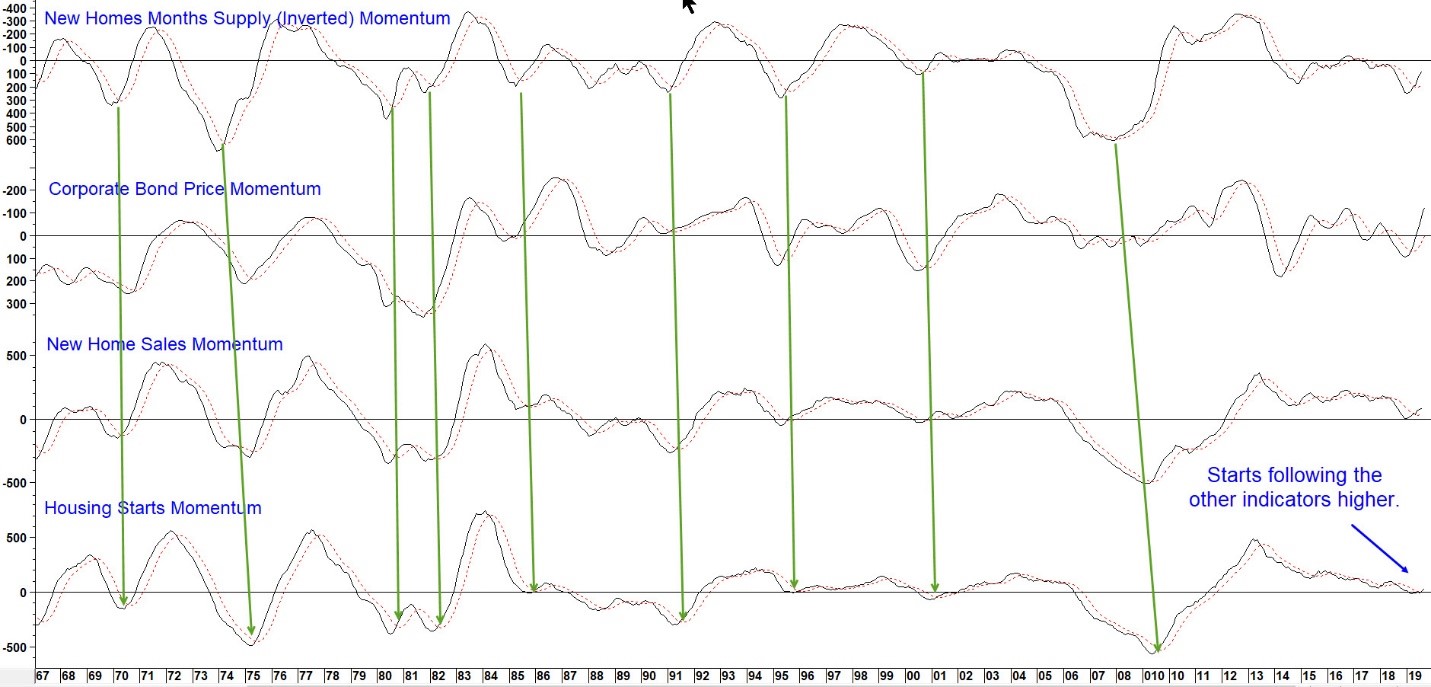
Sources: Pring Research
What’s next? This chronological arrangement signals a forthcoming expansion in housing starts momentum and improving economy. (click chart to enlarge)
Our third indicator is the Pring Turner Leading Economic Indicator or PTLEI, a composite comprising data from the consumer, stock market, housing and labor. The red highlights once again display official recessionary periods. The average lead time during the six decades shown in the chart was 10 months. One shortcoming is that it signaled the growth slowdown in1966 that did not fully deteriorate into recession. In order to offer more timely signals, the bottom panel displays the data in a trend deviation format.
Chart 4 The Pring Turner LEI 1964-2019
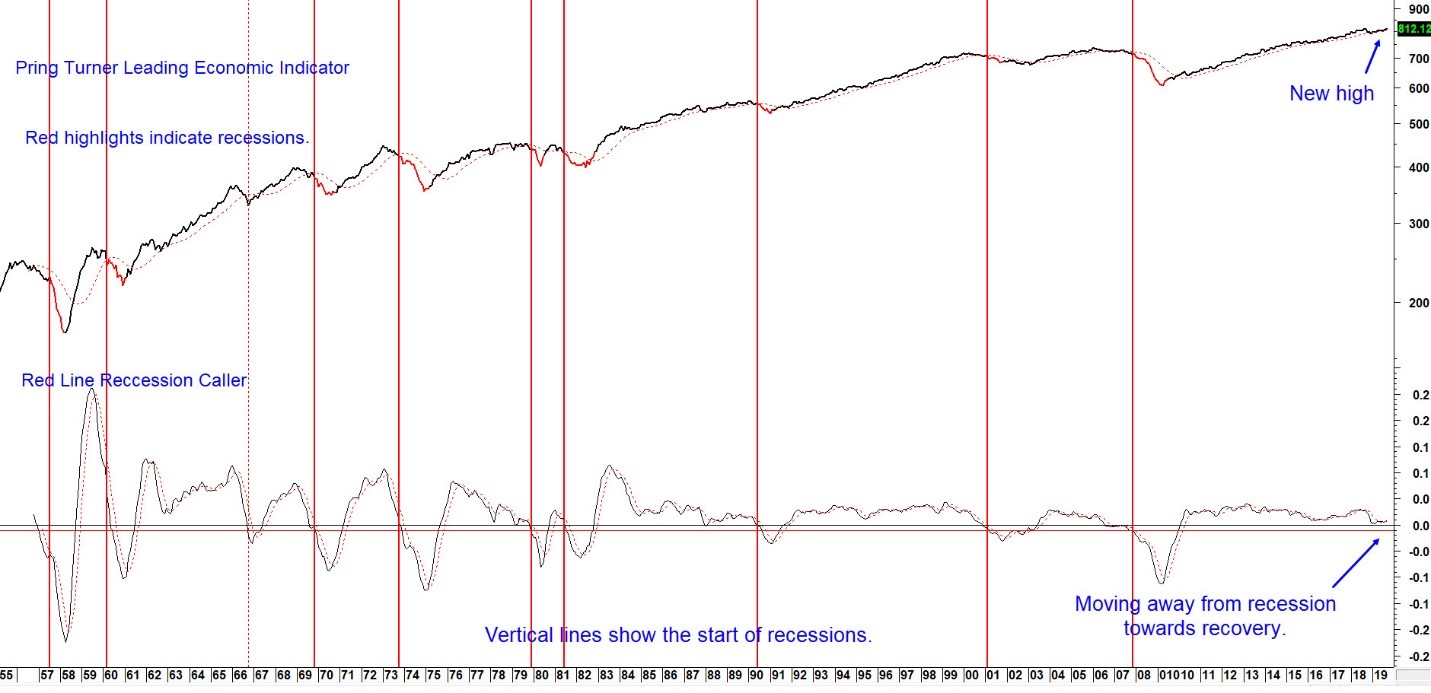
Source: Pring Research
The Pring Turner LEI is at a record high (top panel) with momentum improving (bottom panel), signaling an imminent end to the slowdown. (click chart to enlarge)
The Recession Caller gets its name by triggering a recession warning as it crosses below its horizontal red recession triggering line just below zero. In the last few months it has begun to move away from the line, reducing the chance of an upcoming recession. Moreover, the indicator itself is at an all-time high. Both observations argue for another leg higher in the 2009-20?? economic expansion.
Chart 5 S&P Composite and the Stock Market Kicker 1963-2019
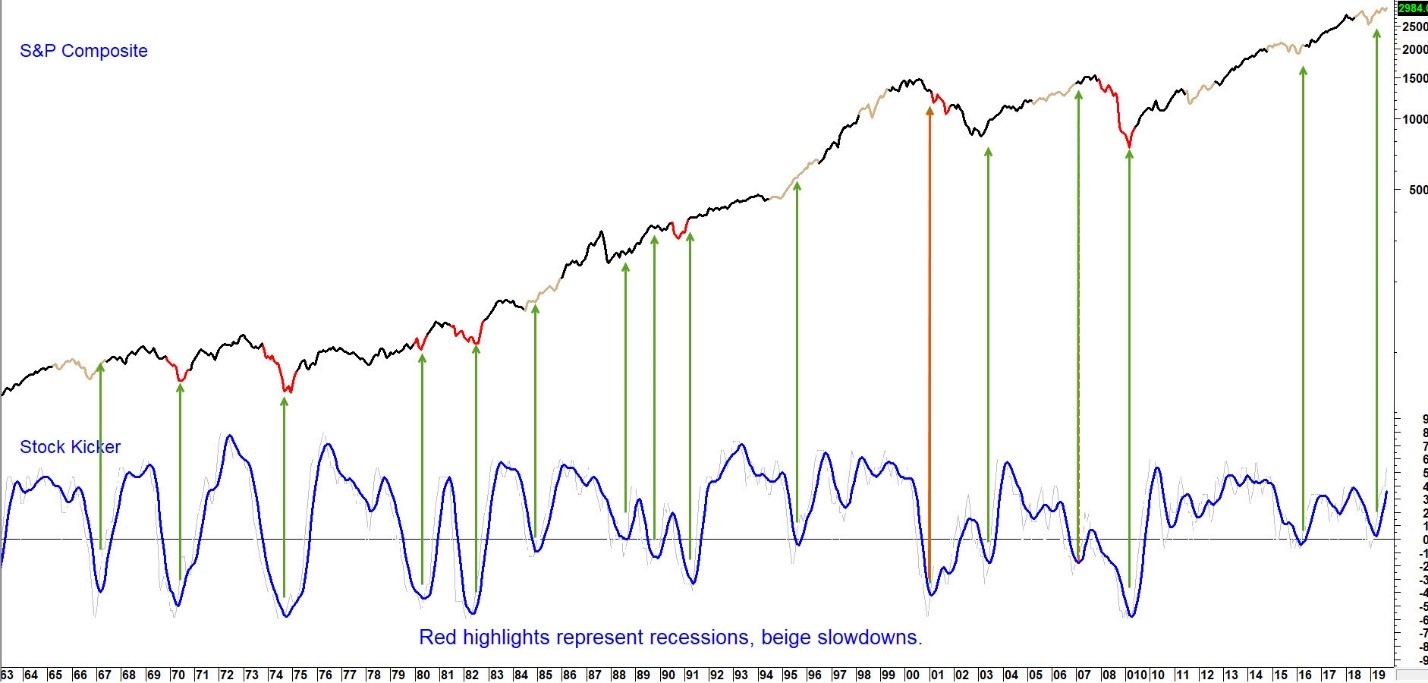
Source: Pring Research
The Stock Market Kicker upside reversal argues for higher equity prices and a stronger economy. (click chart to enlarge)
Finally, Chart 5 features the S&P Composite together with another economic indicator, which we term the Stock Market Kicker. It is calculated by monitoring a universe of leading economic indicators in a positive trend. It’s called the “Kicker” because upside reversals in its (blue) 6-month MA has a strong tendency to “kick” the stock market higher. Previous successful reversals have been flagged by the green arrows. The red one, in 2001, correctly forecasted the economy, but equities failed to respond due to the unwinding of the tech bubble.
The Kicker reversed again earlier in the year and has been moving up sharply. That is good news for both equities and the economy. Note for instance, how previous upward reversals have coincided with the ending phases of all recessions (red highlights) and most slowdowns (beige highlights) in the last 60-years.
Summary
New highs in some of these reliable leading economic indicators are likely foreshadowing a resurgence in economic growth. We do not know precisely when that will happen or how long the expected renewed growth pattern will last. Based on past trajectories positive economic momentum ought to continue well into next year and reward stock investors along the way. Stay tuned for further updates.
Cover Photo by AbsolutVision on Unsplash