
Joe Turner was the guest speaker at the San Francisco Technical Securities Analysts Association webinar on January 10, to present his 2019 financial market outlook. The TSAA – SF is the oldest society dedicated to helping investors become more knowledgeable and profitable through the application of technical analysis. Joe is a long time member and past president of this professional group. This report is a short summary of the webinar presentation.
The presentation included our 2019 financial markets outlook, but we acknowledged that our crystal ball was cloudy beyond the first few months of the new year. Our view is the business cycle is definitely slowing down and the critical threshold for markets will be whether the economy would only experience a temporary slowdown or actually slip into a more serious recession. The answer is important because a recession usually brings deep and lengthy bear markets while slowdowns bring less severe and much shorter stock market declines. For investors that means markets and investor portfolios can quickly climb back from a temporary market decline. The jury is still out on this question. Martin Pring recently published an in-depth report, “A Slowdown is in the Bag, but What about a Recession?”, that provides a roadmap and indicators to follow to see which way the economy goes….slowdown or recession? Stay tuned!

The one thing all investors have in common is the desire to make investment decisions faced with an unknown future that gives a favorable or profitable outcome. The decisions are based upon collecting and processing information and organizing it in a systematic manner that increase the probability of success. The organization of information and decision-making process should be one that can be replicated over and over and over again even though the investment world and economy are in a constant state of change and evolution.
Our firm has utilized the same principled decision-making process for over 40 years. It starts by analyzing the secular (10 to 20 year) outlook determined by long term trends and valuation levels for the major asset groups. Next is an examination of the current business cycle stage and direction that research shows greatly influences the cyclical risk or opportunity of the major asset classes. Then we drill down to the next smaller time frame of intermediate trends (2 to 6 month outlook) as defined by our Fuel Tank model which we will review with you a few slides later. The Fuel Tank is designed to identify those turning points in the stock market that occur several times a year and can help us trim or plant equities in client portfolios that might give a small incremental edge. The final step in the process is the heart of a strong risk management discipline for client portfolios. Here we turn to company specific fundamentals and apply this to the last component of building client portfolios. A higher level of quality, better measures of valuation, and the selection of higher and growing dividend income than the average company combine to help generate better returns with less risk.
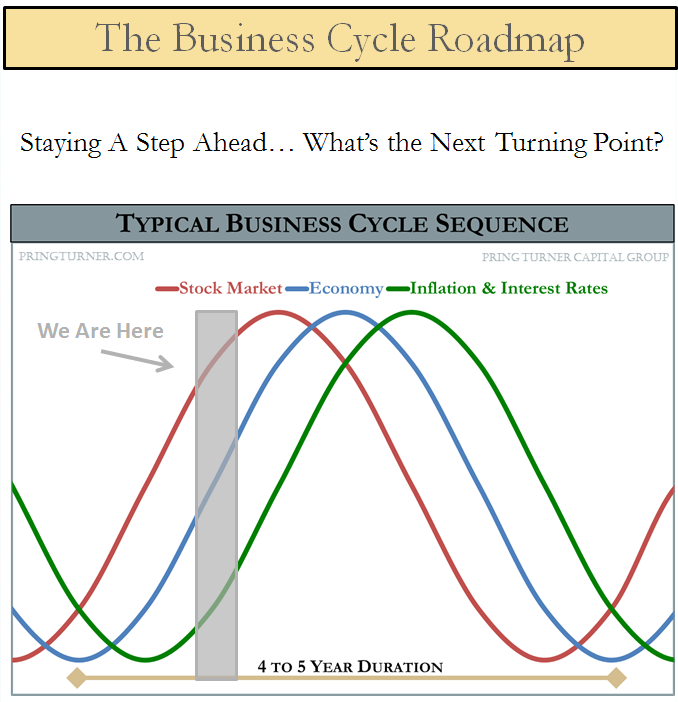
This simple, yet elegant chart illustrates the relationship between stocks, bonds, inflation-sensitive assets and the economy. The diagram demonstrates a typical business cycle path with stock prices leading the economy while interest rates and inflation tends to lag. This sequence is pretty consistent behavior as research going back to the 1850’s demonstrates. We are currently late in the 35th U.S. business cycle. Yes, each cycle has its own unique personality and no two are identical, but the basic sequence plays out in a logical manner. Where are we today? The grey shaded area is our best estimate of current conditions.
Historically cycles run 4 to 5 years, but this business expansion which began July 2009 has been unusually long and slow growing. The cycle has experienced two slowdowns (2011 and 2015-2016) where the expansion faltered but did not slip into a recession. For now, it appears the economy is going though slowdown number 3 and hopefully does not turn into a full blown recession. This is why Martin’s checklist mentioned earlier is so important to follow.
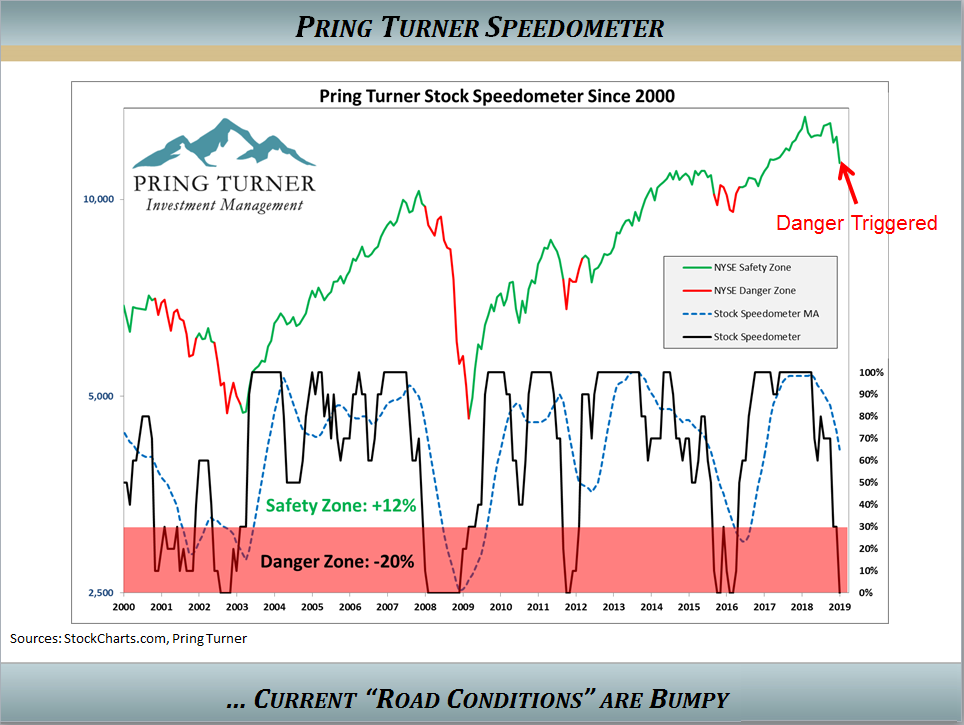
We developed a “primary trend indicator”, nicknamed the Stock Speedometer, to help us decide if we should be driving portfolios fast (growth mode) or slow (protect mode). The Speedometer was first introduced in our April 2016 Newsletter. The speedometer is designed to identify the primary environment of the stock market. Similar to your car speedometer, it signals how fast or slow we drive your portfolio. As the Speedometer changes we make important portfolio adjustments in order to better navigate the financial road conditions ahead.What is the Stock Speedometer telling us today?
At the end of December 2018 this risk management tool fell into the “danger” zone where historically returns are negative. The indicator begins 2019 at zero—it’s lowest possible reading and only the 5th time in 19 years that it has reached the zero level. This tells us to proceed defensively in portfolios until road conditions improve and we deem it safer to “drive” portfolios faster. The good news is that about ¾ of the time the Stock Speedometer is in the “safety” zone and above average returns are possible.
The Speedometer stayed in the ‘Danger Zone’ for lengthy periods in 2001-2002 and again in 2008-2009 while the stock indices dropped more than 50%! Both market selloffs reflected recessionary periods. Now note the Speedometer levels and durations during the 2011 and 2015-2016 slowdowns. Those market declines triggered by only temporary slowdowns were far less deep and recovered any price damage fairly quickly.
Even though the speedometer cautions us on the primary trend, our intermediate term model, the Fuel Tank, is quite full and is a very good reason to be optimistic over the next few weeks and possibly months.
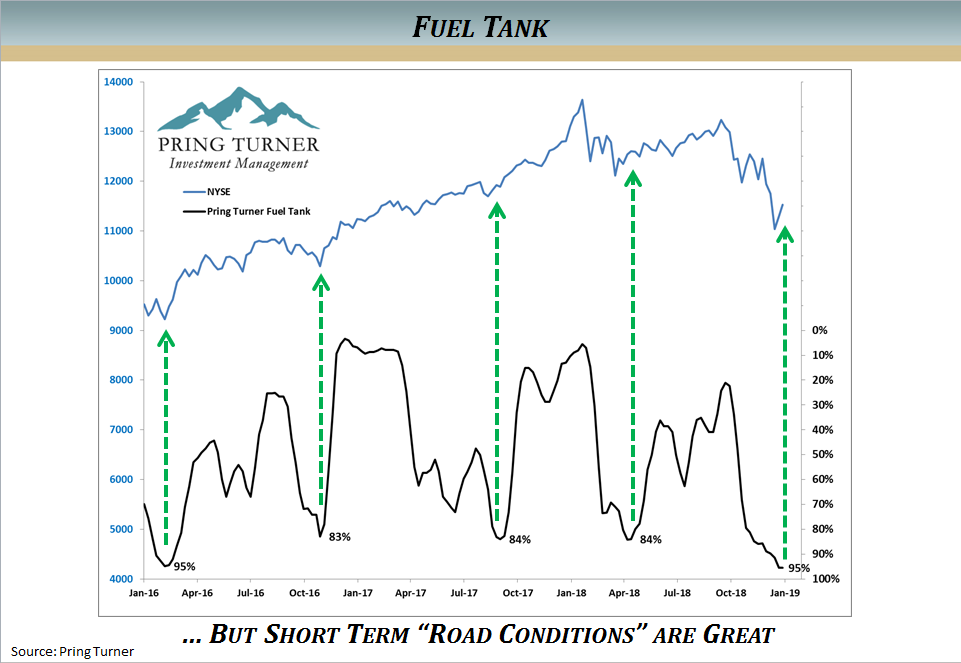
The Fuel Tank is our intermediate term model to alert us when the next 2 to 6 months stock market change is likely favorable or unfavorable. Just as the fuel gauge reading in your automobile tells you if you can travel a long distance or not, so this Fuel Tank is similarly designed to do the same for the stock market. High levels of fuel, as of the presentation date (1/10/2018) is 95% full, give us confidence the market can go quite higher for a period of time before running out of gas. While there will very likely be additional market zigzagging in the weeks ahead, we fully expect a strong and durable market rally to ensue as the Fuel Tank empties. We are carefully evaluating the character of the current market rebound for any indications that would change the primary trend (Speedometer) back toward a more optimistic reading. Another reason for you to stay tuned!
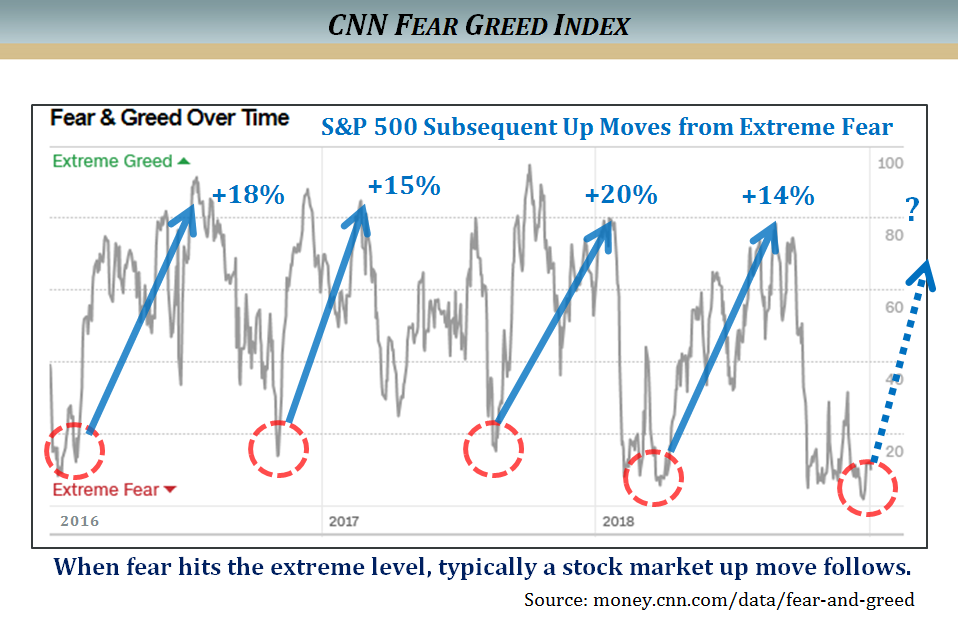
One important component of our Fuel Tank model is investor sentiment, which we will demonstrate with this chart. CNN Business created the “Fear and Greed Index” which attempts to measure the current emotional state of investors. It can range from a maximum “Greed” reading of 100 to a maximum “Fear” reading of 0. At year end it reached an extreme low of just 3*, clearly demonstrating that fear reigned supreme. Historically this level of extreme fear has been an excellent indicator for future stock market gains. The chart illustrates the past 4 extreme levels of fear reached in the past three years and the subsequent stock market rallies as fear recedes. Over the next several months, double digit gains were enjoyed by patient investors.
*note readings can change rapidly.
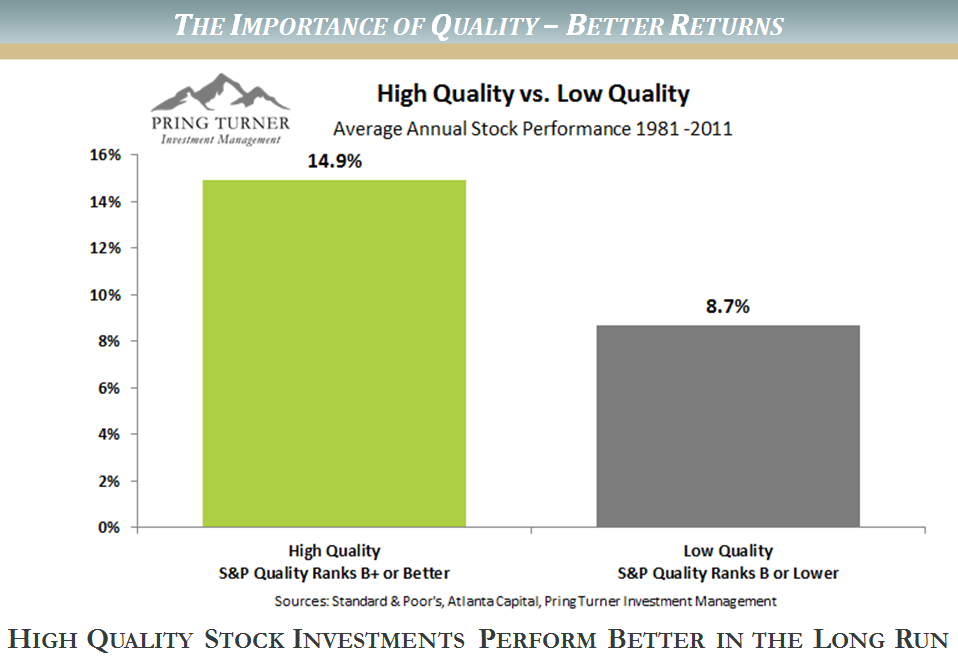
As a conservative investment management firm, we have always built many layers of risk protection into portfolios, including the key components of quality, value and income. High quality companies consistently grow their earnings regardless of the underlying business atmosphere. The so-called “cream of the crop” have key competitive advantages that allow them to prosper in the long run. Standard and Poor’s (S&P) has published quality rankings on stocks over many decades. These rankings are based on the company’s most recent 10 years of earnings and dividend data and range from A+ (highest) through D (Lowest). History shows that high quality stocks (ranked B+ or better) generate better returns over the long run. In this long term S&P study, high quality stocks earned average annual returns of 14.9%, significantly outperforming its low quality counterparts (ranked B or lower) at 8.7%.
Given the superior performance of high quality investments, you might find it fascinating that they actually are less risky to boot. Our next slide demonstrates the benefit of owning high quality stocks during market downturns.
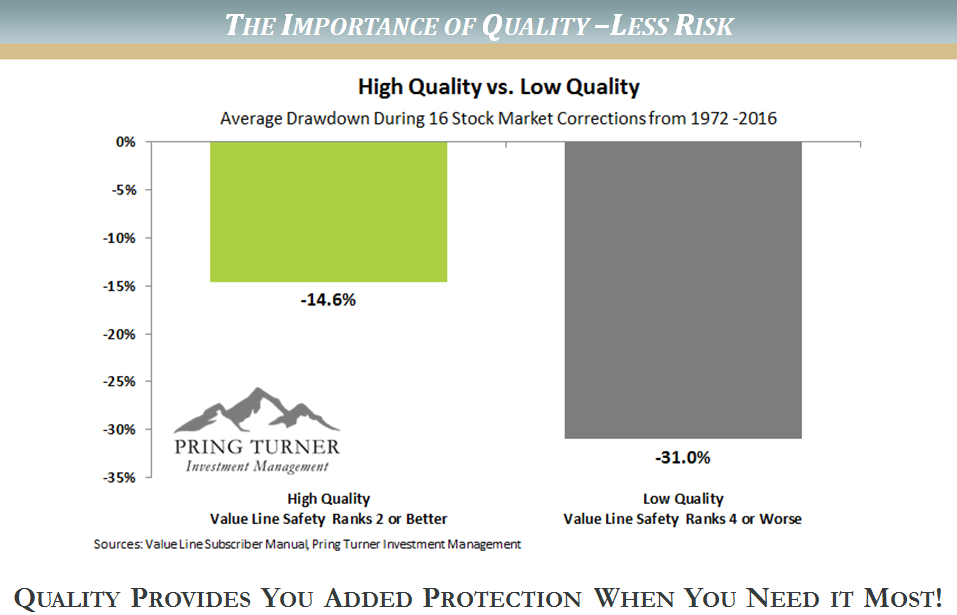
And just how do quality stocks behave in serious market declines? ValueLine, founded in 1931, is a highly regarded independent investment research publishing firm that publishes “safety rankings”. Their ranking system compares and combines balance sheet, financial strength and price stability to arrive at a safety ranking. Ranks of 1 and 2 are the highest quality and safety levels. Rankings of 3 are average, while safety rankings of 4 or 5 are below average for quality and safety. As shown in the table, historically the stocks with the highest quality rankings go down much less during significant stock market declines. Who said you can’t have your cake (better returns) and eat it too (less risk)?
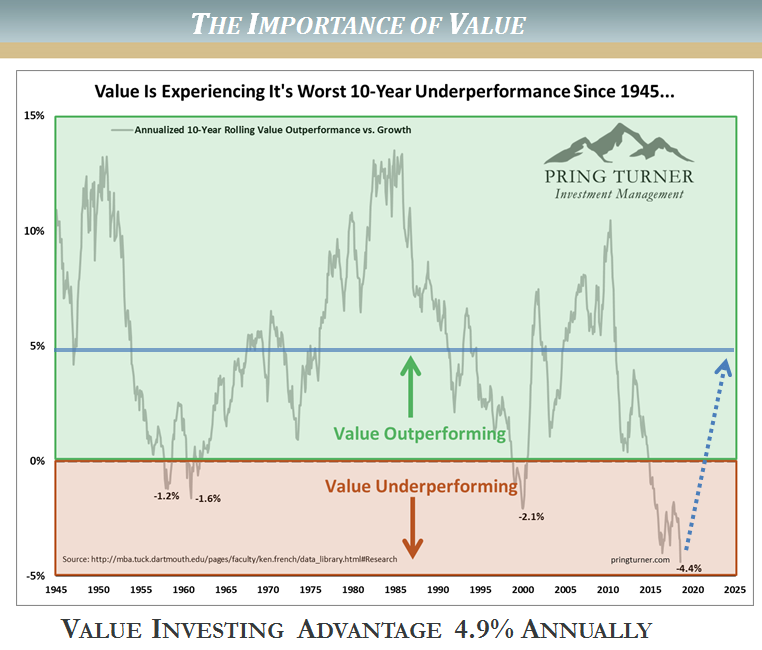
We could fill an entire library with academic studies that demonstrate a disciplined value approach gives far superior returns with less risk than a growth approach. In other words, growth gets the glamorous headlines, while value quietly gets the better results. Our experience and long-term track record demonstrate that when you combine a playbook for both offense and defense, along with disciplined value investing, investors can achieve solid risk-adjusted returns.
No investment approach is perfect, even the most successful investment strategies will temporarily fall out of favor and their followers may lose patience. Such has been the case in recent years as value investing has not kept pace with its faster moving brethren. So, what can value investors expect looking forward? The chart compares these two investment styles and illustrates that every temporary period of under-performance for value vs. growth investing in the past 70 years has experienced a return to value’s pre-eminence with strong absolute and relative performance. We believe the environment today is quite similar to the early 2000’s following the dot.com bust when leadership changed and value stocks outperformed for a number of years. Evidence is building that value is starting to once again reassert its long-term dominance of roughly 5% annual out-performance.
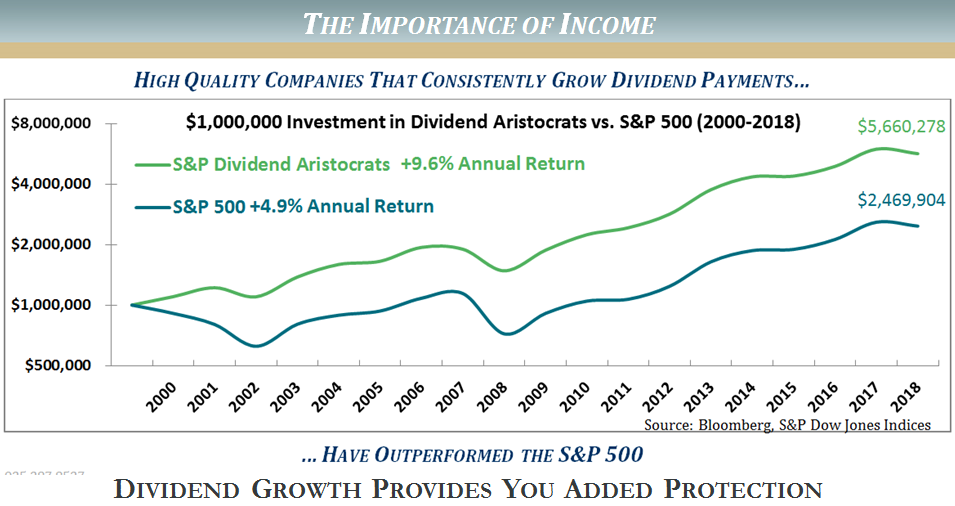
Quality, Value and Income are 3 key factors emphasized to protect and grow our clients valuable assets. Income is often the under-appreciated factor. The chart illustrates the power of dividend growth over time. Since 2000 the S&P Dividend Aristocrat Index, comprised of companies that have consistently grown dividends for 25+ years, has significantly outpaced the S&P 500. Similar to the Dividend Aristocrat index, we consciously seek companies that generate substantially higher income than the overall market while providing consistent dividend growth and safety.
A highly selective and robust process is utilized to place growing dividend income into portfolios. Higher dividends, with a margin of safety, and history of yearly increases is a wonderful recipe to generate healthy total returns over the long-run. One additional advantage to a higher yielding stock portfolio is that solid dividend income acts as a downside shock absorber when the markets go through their periodic declines, such as experienced last quarter. As the chart illustrates, stocks that pay an attractive and safe dividend generally hold up better when markets drop. In turn, this stability and dependable income stream is designed to reward investors while patiently waiting for long term capital gains to accrue.
Summary of 2019 Financial Market Outlook
The Crystal Ball is Hazy!
Economic Recession or Temporary Slowdown? The jury is still out.
The Bad News—the “Stock Speedometer” Is In the “Danger” Zone. Caution is Warranted.
The Good News—the “Fuel Tank” is Quite Full. Expect the Intermediate Term Rally to Continue.
Will the Current Rally be Strong Enough to Improve the Speedometer to a More Optimistic Reading?
Time will Tell—Stay Tuned!
On Tuesday, February 19th at 5:00 PM PST, Martin Pring will join Joe Turner for Part Two of their 2019 Market Outlook presentation exclusively for TSAA-SF members and guests. Click here to register.